

Answered step by step
Verified Expert Solution
Question
1 Approved Answer
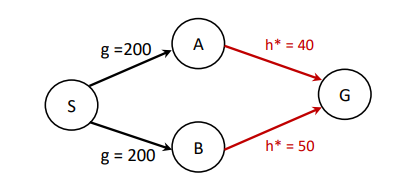
Consider the following graph, where S is the start state and G is the goal. The arrows in black indicate the actual cost of getting
Consider the following graph, where S is the start state and G is the goal. The arrows in black indicate the actual cost of getting from one state to the next while the arrows in red indicate the optimum estimated cost of getting from a state to the next. I just would like to understand how I would answer this question.
Apply the A algorithm for the following cases. Recall that the value at a node N is calculated as fN g h
Case :Overestimation by the algorithm
hfrom A to G
hfrom B to G
Case : Underestimation by the algorithm
hfrom A to G
hfrom B to G
Discuss the solutions obtained in both cases. What is your conclusion?
Step by Step Solution
There are 3 Steps involved in it
Step: 1

Get Instant Access to Expert-Tailored Solutions
See step-by-step solutions with expert insights and AI powered tools for academic success
Step: 2

Step: 3
Ace Your Homework with AI
Get the answers you need in no time with our AI-driven, step-by-step assistance
Get Started
Microsoft Visual Basic 2008 Comprehensive Concepts And Techniques
Authors: Gary B. Shelly, Corinne Hoisington
1st Edition
1423927168, 978-1423927167