

Question
Consider the following graphs of the US data since 1960 on the price level3 (top left), money supply4 (top right), real output5 (bottom left) and
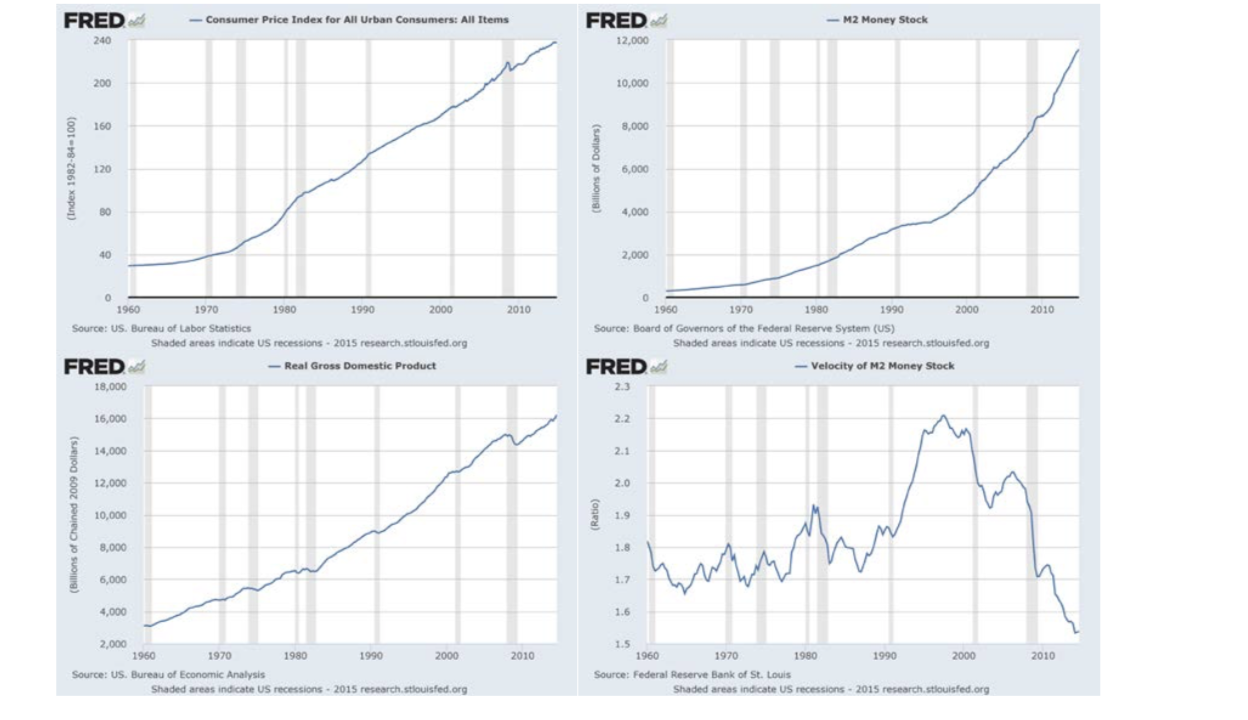
Consider the following graphs of the US data since 1960 on the price level3 (top left), money supply4 (top right), real output5 (bottom left) and the velocity of money6 (bottom right). Note that US recessions are shaded in grey.
When applying the quantity theory of money ???? = ????, or the rule-of-thumb version of it based on growth rates, we often treat velocity as constant in the long run. Is this a reasonable simplification? Are there times when the V-is-constant approximation would have been particularly unhelpful?
Step by Step Solution
There are 3 Steps involved in it
Step: 1

Get Instant Access to Expert-Tailored Solutions
See step-by-step solutions with expert insights and AI powered tools for academic success
Step: 2

Step: 3
Ace Your Homework with AI
Get the answers you need in no time with our AI-driven, step-by-step assistance
Get Started
Econometric Analysis
Authors: William H. Greene
5th Edition
130661899, 978-0130661890