Answered step by step
Verified Expert Solution
Question
1 Approved Answer
Consider the following passive membrane equation T dv dt = -(VEL) + R lapp(t) (1) with EL = -60 mV, C = 1 F/cm2


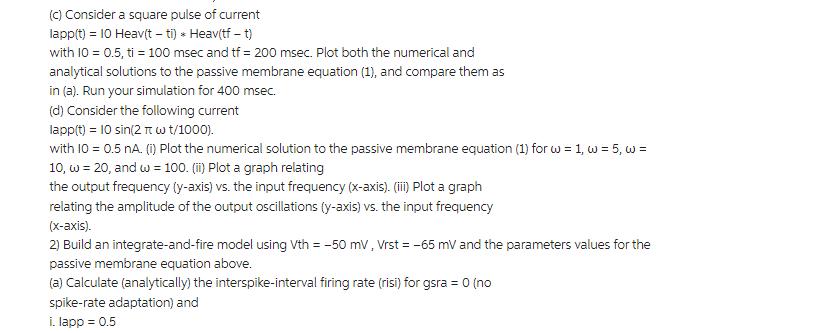
Consider the following passive membrane equation T dv dt = -(VEL) + R lapp(t) (1) with EL = -60 mV, C = 1 F/cm2 , GL = 0.1 mS/cm2 , Write a Matlab code (or use the template code) to solve eq. (1). Use V (0) = -60 mV and the following units for V, t and lapp respectively: [V] = mv,[t] = msec, [lapp] = A/cm2 (a) Calculate the time constant T. 1 (b) Consider the following two time-independent applied currents lapp = -0.5 and lapp = 0.5. For each value of lapp (lapp = 0.5 and lapp = -0.5) compare the numerical and analytical solutions to the passive membrane equation (1) by (1) plotting superimposed graphs of these solutions, and (ii) plotting the error (absolute value of the difference between these two solutions). (c) Consider a square pulse of current lapp(t) = 10 Heav(t-ti) * Heav(tf-t) with 10 = 0.5, ti = 100 msec and tf = 200 msec. Plot both the numerical and analytical solutions to the passive membrane equation (1), and compare them as in (a). Run your simulation for 400 msec. (d) Consider the following current lapp(t) = 10 sin(2 w t/1000). with 10 = 0.5 nA. (i) Plot the numerical solution to the passive membrane equation (1) for w = 1, w = 5, w = 10, w = 20, and w = 100. (ii) Plot a graph relating the output frequency (y-axis) vs. the input frequency (x-axis). (iii) Plot a graph relating the amplitude of the output oscillations (y-axis) vs. the input frequency (x-axis). 2) Build an integrate-and-fire model using Vth = -50 mV, Vrst = -65 mV and the parameters values for the passive membrane equation above. (a) Calculate (analytically) the interspike-interval firing rate (risi) for gsra = 0 (no spike-rate adaptation) and i. lapp = 0.5 ii. lapp = 1 iii. lapp = 1.01 iv. lapp = 2 Plot the corresponding numerical solutions and compare your analytical and numerical results. (b) Compute the numerical solutions and plot the corresponding graphs for for lapp = 2, Ek = -85, Agsra = 0.1 and i. Tsra = 10 msec. ii. Tsra = 100 msec.Type or paste question here
Step by Step Solution
★★★★★
3.42 Rating (152 Votes )
There are 3 Steps involved in it
Step: 1

Get Instant Access to Expert-Tailored Solutions
See step-by-step solutions with expert insights and AI powered tools for academic success
Step: 2

Step: 3

Ace Your Homework with AI
Get the answers you need in no time with our AI-driven, step-by-step assistance
Get Started


