Answered step by step
Verified Expert Solution
Question
1 Approved Answer
Consider the following regression model, +Bx te; 2 12 k ik where Ele, 1x]=0 and Var (el.x) depends on the value of x,, i.e.,
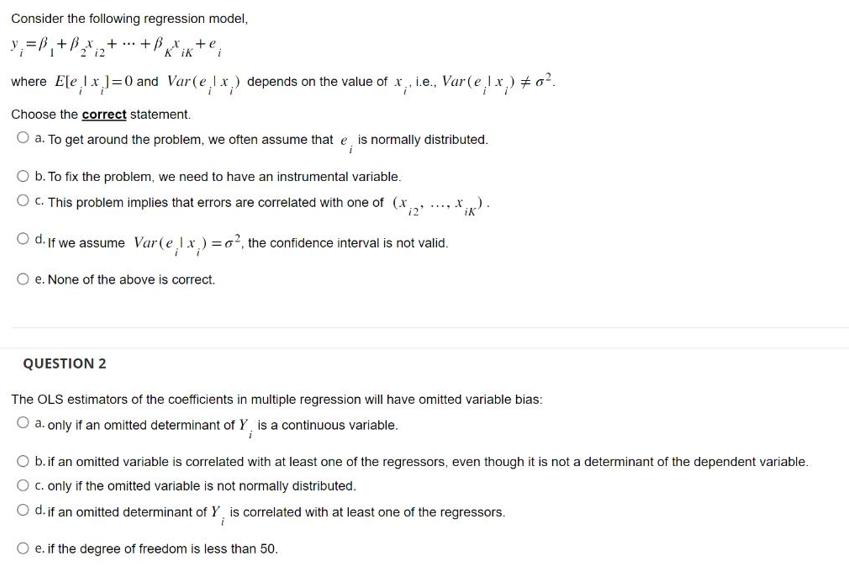
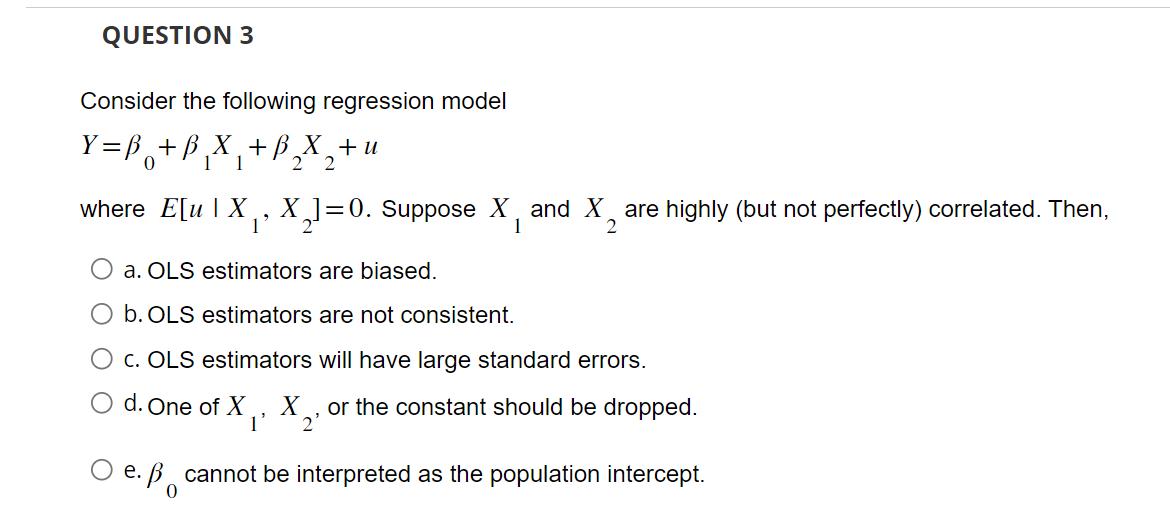
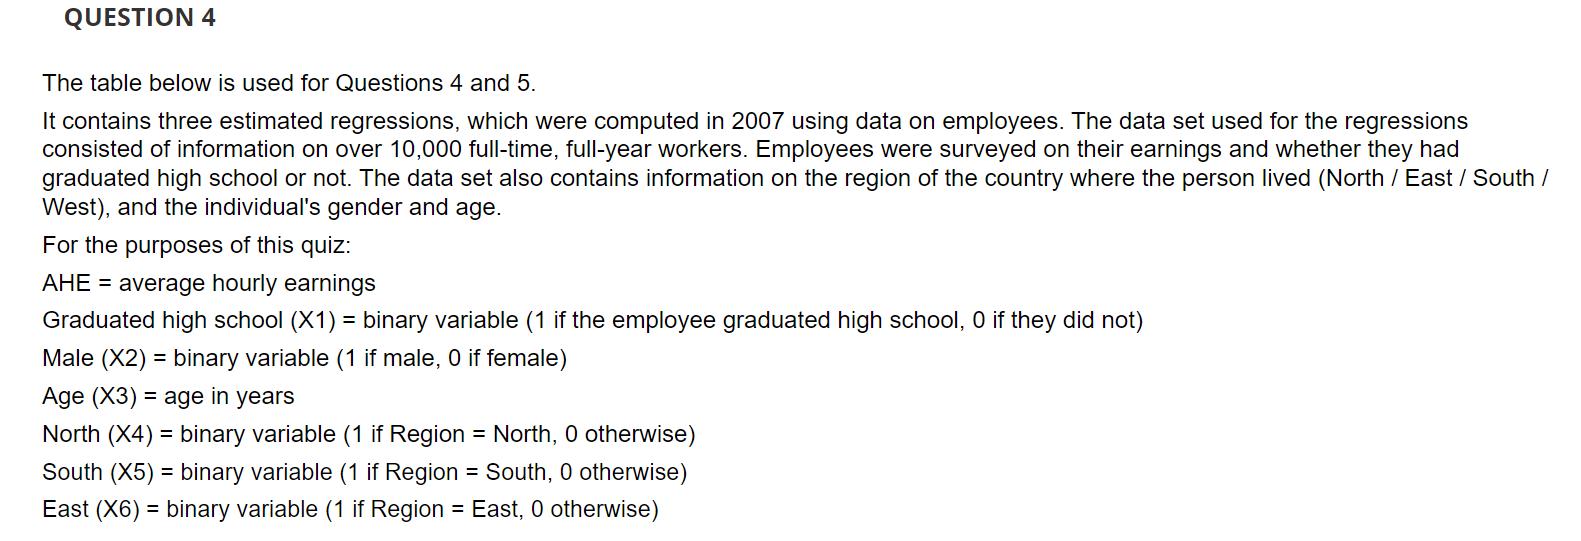
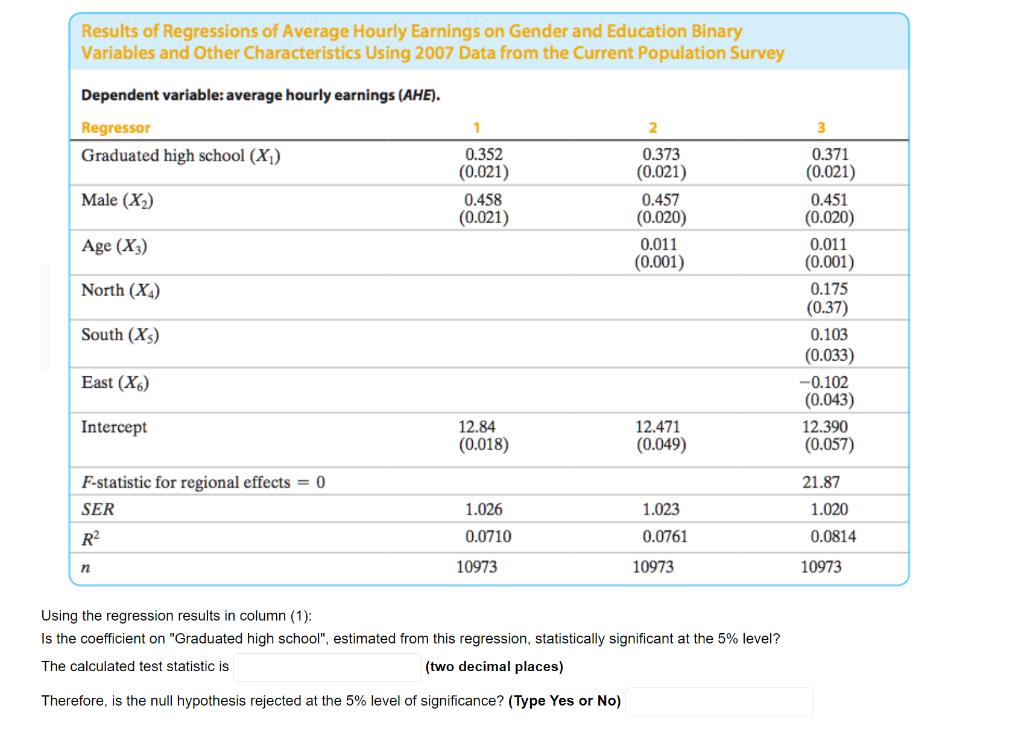
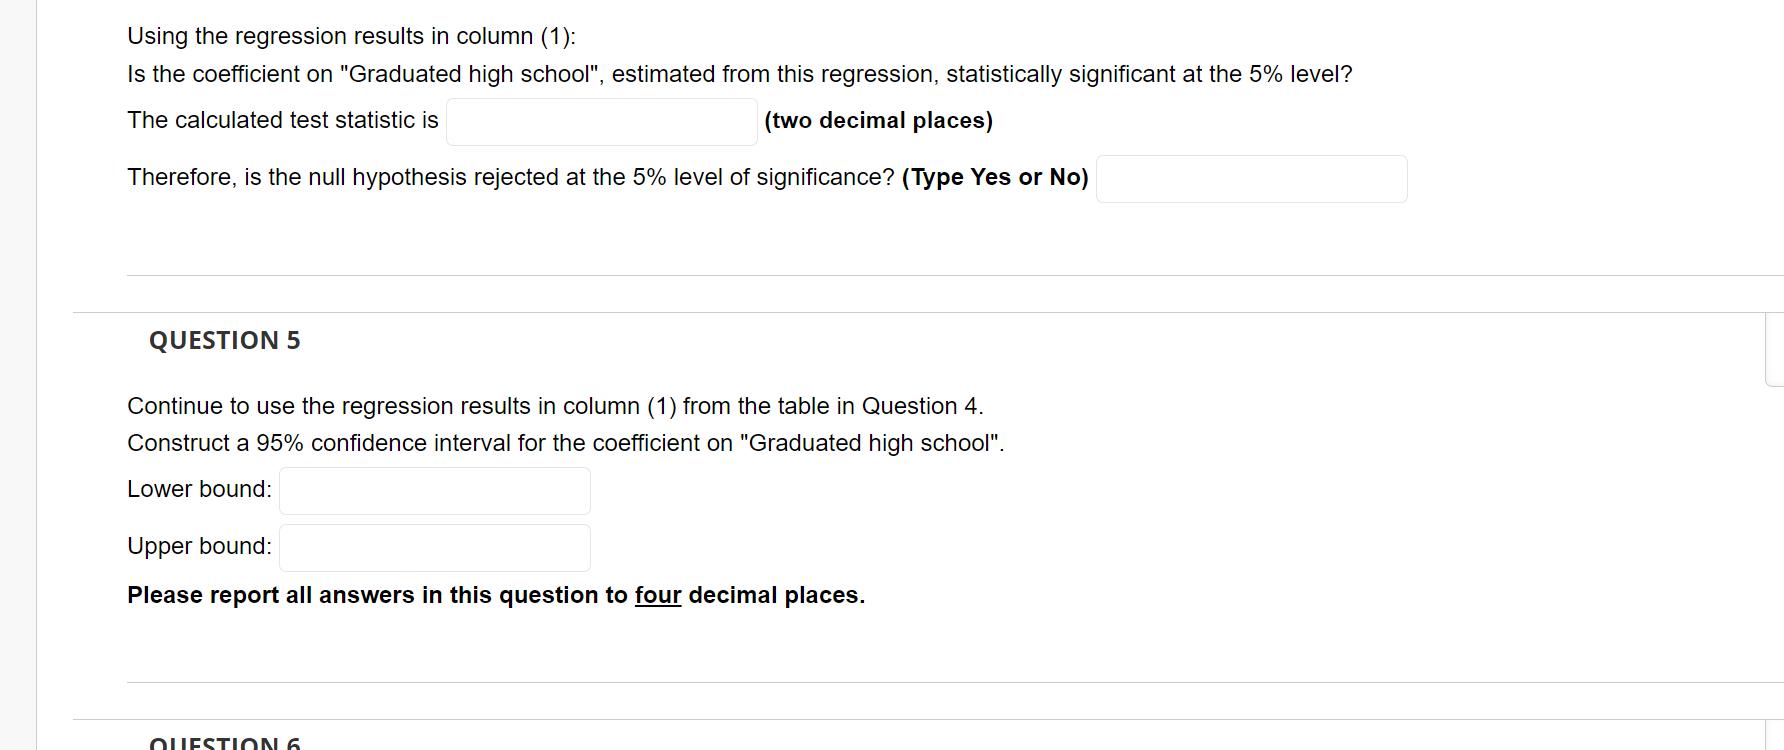
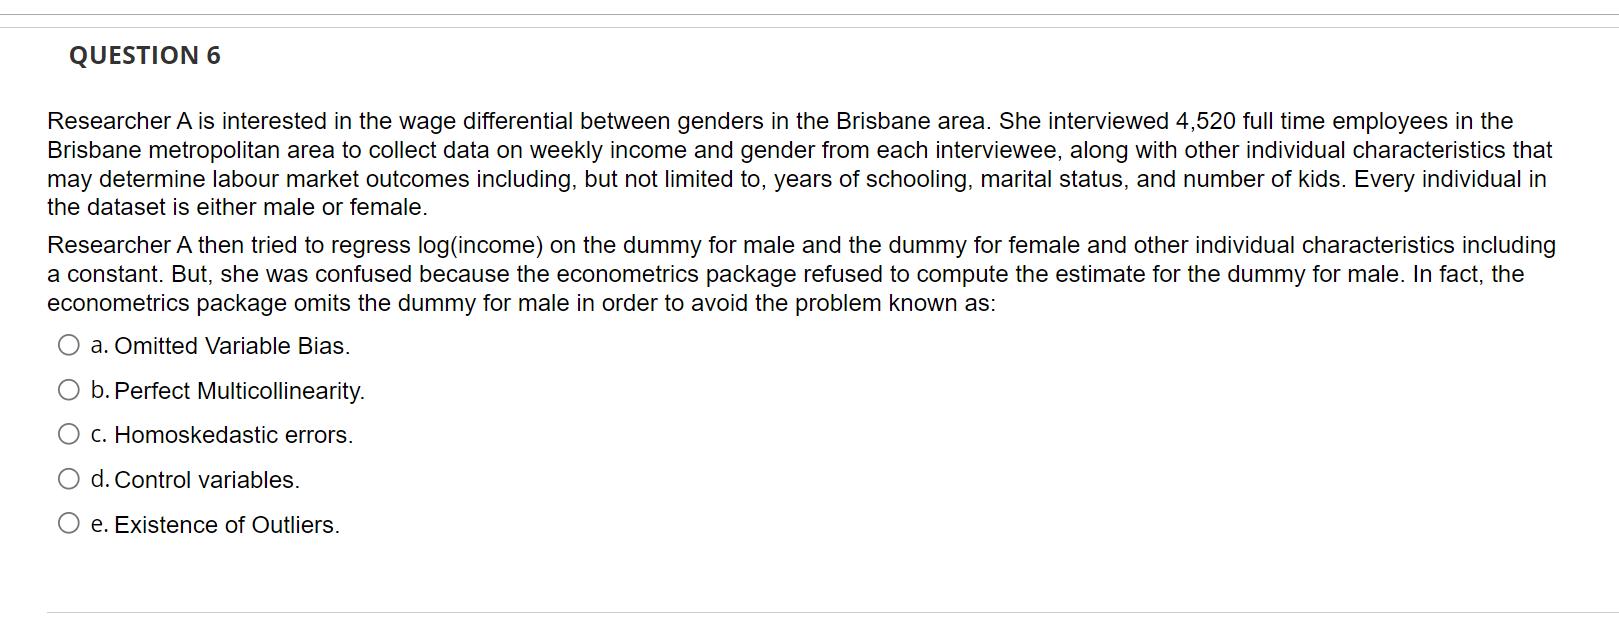
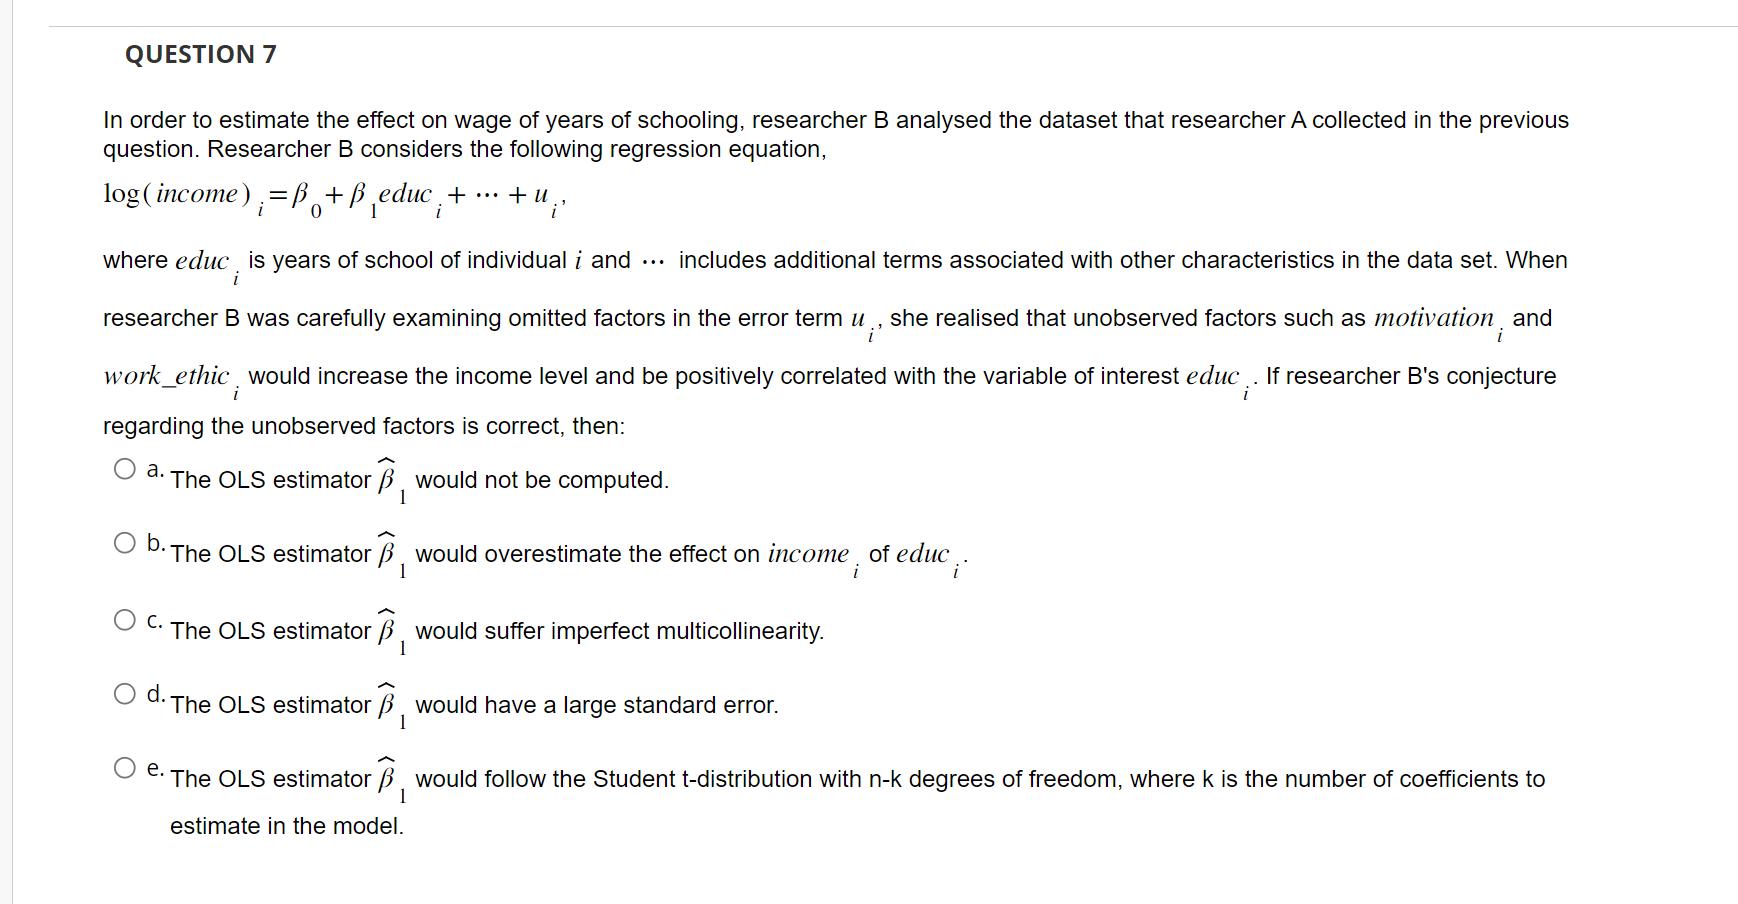
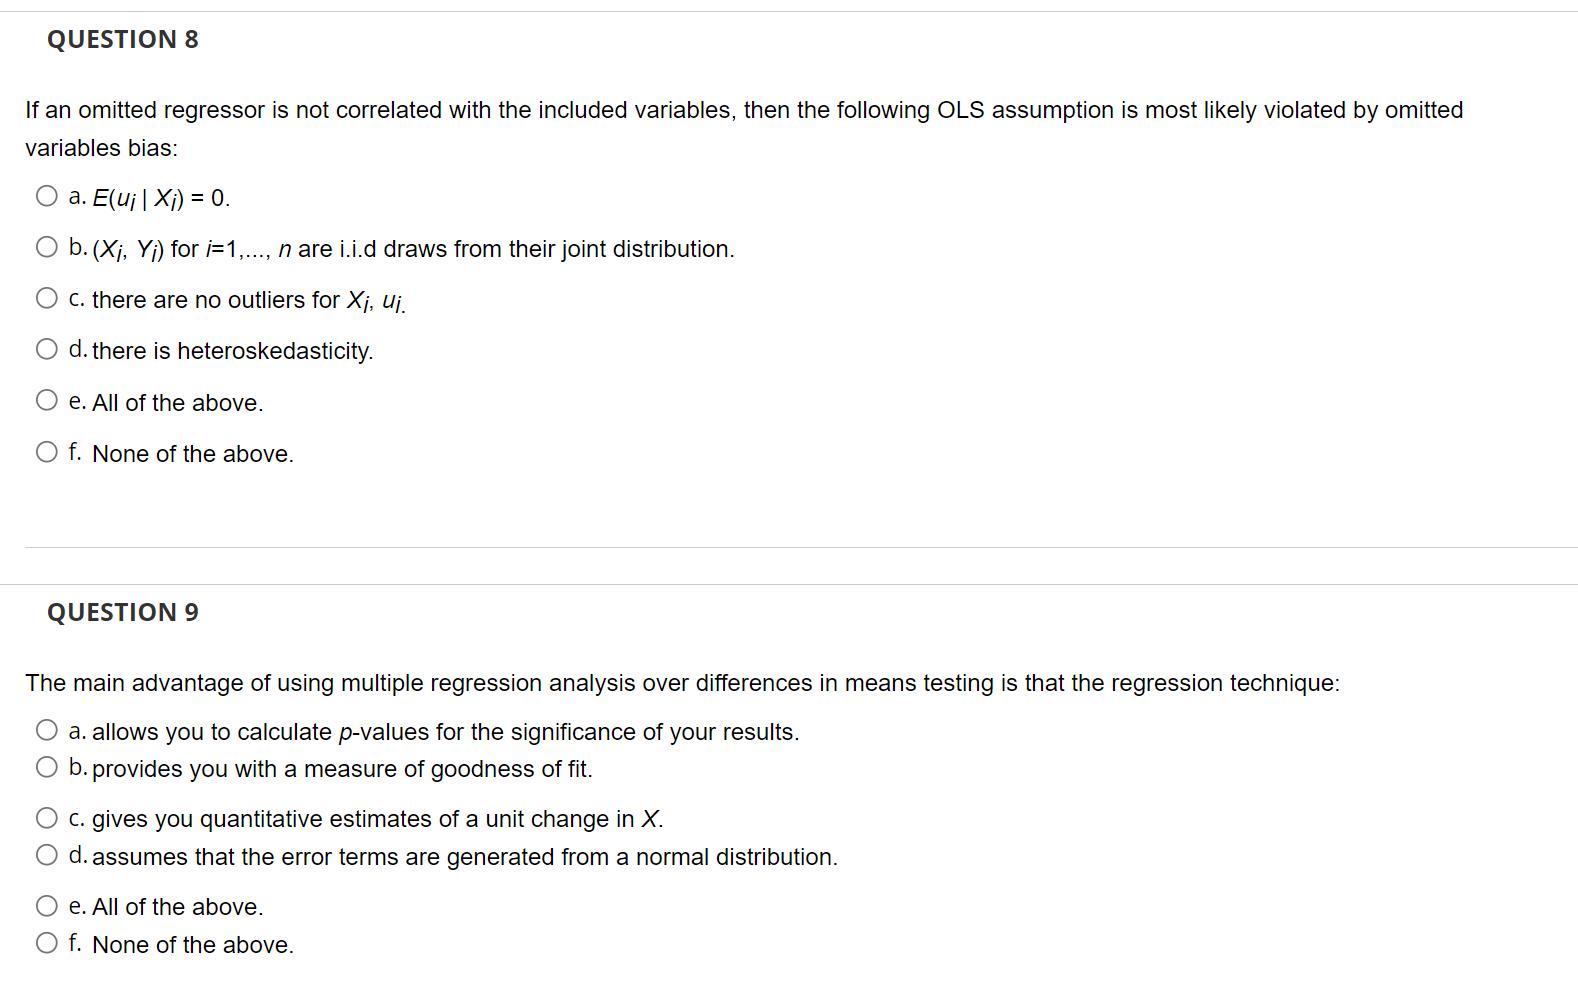
Consider the following regression model, +Bx te; 2 12 k ik where Ele, 1x]=0 and Var (el.x) depends on the value of x,, i.e., Var(e,1x) 0. Choose the correct statement. O a. To get around the problem, we often assume that e, is normally distributed. O b. To fix the problem, we need to have an instrumental variable. O c. This problem implies that errors are correlated with one of (x Od. If we assume Var (ex)=o, the confidence interval is not valid. O e. None of the above is correct. QUESTION 2 The OLS estimators of the coefficients in multiple regression will have omitted variable bias: O a. only if an omitted determinant of Y, is a continuous variable. b. if an omitted variable is correlated with at least one of the regressors, even though it is not a determinant of the dependent variable. O c. only if the omitted variable is not normally distributed. O d. if an omitted determinant of Y, is correlated with at least one of the regressors. O e. if the degree of freedom is less than 50. QUESTION 3 Consider the following regression model Y=B+B X +B_X + u 0 1 2 2 where E[u | X, X]=0. Suppose X and X are highly (but not perfectly) correlated. Then, 1 2 O a.OLS estimators are biased. O b. OLS estimators are not consistent. O c. OLS estimators will have large standard errors. d. One of X X or the constant should be dropped. 2 O e. cannot be interpreted as the population intercept. 0 QUESTION 4 The table below is used for Questions 4 and 5. It contains three estimated regressions, which were computed in 2007 using data on employees. The data set used for the regressions consisted of information on over 10,000 full-time, full-year workers. Employees were surveyed on their earnings and whether they had graduated high school or not. The data set also contains information on the region of the country where the person lived (North / East / South / West), and the individual's gender and age. For the purposes of this quiz: AHE = average hourly earnings Graduated high school (X1) = binary variable (1 if the employee graduated high school, 0 if they did not) Male (X2) = binary variable (1 if male, 0 if female) Age (X3) age in years North (X4) = binary variable (1 if Region = North, 0 otherwise) South (X5) = binary variable (1 if Region = South, 0 otherwise) East (X6) = binary variable (1 if Region = East, 0 otherwise) = Results of Regressions of Average Hourly Earnings on Gender and Education Binary Variables and Other Characteristics Using 2007 Data from the Current Population Survey Dependent variable: average hourly earnings (AHE). Regressor Graduated high school (X) Male (X) Age (X3) North (X) South (XS) East (X6) Intercept F-statistic for regional effects=0 SER R n 0.352 (0.021) 0.458 (0.021) 12.84 (0.018) 1.026 0.0710 10973 0.373 (0.021) 0.457 (0.020) 0.011 (0.001) 12.471 (0.049) 1.023 0.0761 10973 Using the regression results in column (1): Is the coefficient on "Graduated high school", estimated from this regression, statistically significant at the 5% level? The calculated test statistic is (two decimal places) Therefore, is the null hypothesis rejected at the 5% level of significance? (Type Yes or No) 0.371 (0.021) 0.451 (0.020) 0.011 (0.001) 0.175 (0.37) 0.103 (0.033) -0.102 (0.043) 12.390 (0.057) 21.87 1.020 0.0814 10973 Using the regression results in column (1): Is the coefficient on "Graduated high school", estimated from this regression, statistically significant at the 5% level? The calculated test statistic is (two decimal places) Therefore, is the null hypothesis rejected at the 5% level of significance? (Type Yes or No) QUESTION 5 Continue to use the regression results in column (1) from the table in Question 4. Construct a 95% confidence interval for the coefficient on "Graduated high school". Lower bound: Upper bound: Please report all answers in this question to four decimal places. QUESTION 6 QUESTION 6 Researcher A is interested in the wage differential between genders in the Brisbane area. She interviewed 4,520 full time employees in the Brisbane metropolitan area to collect data on weekly income and gender from each interviewee, along with other individual characteristics that may determine labour market outcomes including, but not limited to, years of schooling, marital status, and number of kids. Every individual in the dataset is either male or female. Researcher A then tried to regress log(income) on the dummy for male and the dummy for female and other individual characteristics including a constant. But, she was confused because the econometrics package refused to compute the estimate for the dummy for male. In fact, the econometrics package omits the dummy for male in order to avoid the problem known as: a. Omitted Variable Bias. b. Perfect Multicollinearity. c. Homoskedastic errors. d. Control variables. e. Existence of Outliers. QUESTION 7 In order to estimate the effect on wage of years of schooling, researcher B analysed the dataset that researcher A collected in the previous question. Researcher B considers the following regression equation, log(income);=B+B educ; + ... + " ;' u where educ, is years of school of individual i and ... i includes additional terms associated with other characteristics in the data set. When researcher B was carefully examining omitted factors in the error term u she realised that unobserved factors such as motivation, and i' i work ethic would increase the income level and be positively correlated with the variable of interest educ. If researcher B's conjecture regarding the unobserved factors is correct, then: a. The OLS estimator , would not be computed. 1 O b. The OLS estimator B would overestimate the effect on income, of educ.. 1 C. The OLS estimator , would suffer imperfect multicollinearity. 1 O d. The OLS estimator , would have a large standard error. 1 e. The OLS estimator , would follow the Student t-distribution with n-k degrees of freedom, where k is the number of coefficients to estimate in the model. 1 QUESTION 8 If an omitted regressor is not correlated with the included variables, then the following OLS assumption is most likely violated by omitted variables bias: O a. E(uj | Xi) = 0. b. (X, Y) for i=1,..., n are i.i.d draws from their joint distribution. c. there are no outliers for Xi, Uj. d. there is heteroskedasticity. e. All of the above. O f. None of the above. QUESTION 9 The main advantage of using multiple regression analysis over differences in means testing is that the regression technique: a. allows you to calculate p-values for the significance of your results. O b. provides you with a measure of goodness of fit. c. gives you quantitative estimates of a unit change in X. d. assumes that the error terms are generated from a normal distribution. e. All of the above. O f. None of the above.
Step by Step Solution
★★★★★
3.37 Rating (156 Votes )
There are 3 Steps involved in it
Step: 1
The detailed answer for the above question is provided below For the first question d If we assume Varei 2 the confidence interval is not valid This statement is correct If we assume that the error te...
Get Instant Access to Expert-Tailored Solutions
See step-by-step solutions with expert insights and AI powered tools for academic success
Step: 2

Step: 3

Ace Your Homework with AI
Get the answers you need in no time with our AI-driven, step-by-step assistance
Get Started


