Answered step by step
Verified Expert Solution
Link Copied!

Question

1 Approved Answer

Consider the following samples of gas: D sample composition pressure temperature sample composition pressure temperature A 1.1 mol Ne (g) 2.6 atm 319. C 2.8
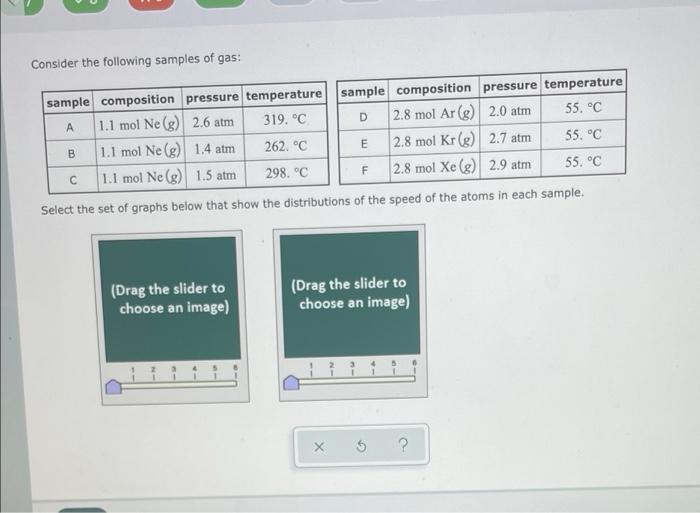
image text in transcribed
Consider the following samples of gas: D sample composition pressure temperature sample composition pressure temperature A 1.1 mol Ne (g) 2.6 atm 319. C 2.8 mol Ar (g) 2.0 atm 55. C 1.1 mol Ne (g) 1.4 atm 262. C E 2.8 mol Kr(g) 2.7 atm 55. C 1.1 mol Ne (g) 1.5 atm 298.C F 2.8 mol Xe (g) 2.9 atm 55. C Select the set of graphs below that show the distributions of the speed of the atoms in each sample. B (Drag the slider to choose an image) (Drag the slider to choose an image) ? Consider the following samples of gas: D sample composition pressure temperature sample composition pressure temperature A 1.1 mol Ne (g) 2.6 atm 319. C 2.8 mol Ar (g) 2.0 atm 55. C 1.1 mol Ne (g) 1.4 atm 262. C E 2.8 mol Kr(g) 2.7 atm 55. C 1.1 mol Ne (g) 1.5 atm 298.C F 2.8 mol Xe (g) 2.9 atm 55. C Select the set of graphs below that show the distributions of the speed of the atoms in each sample. B (Drag the slider to choose an image) (Drag the slider to choose an image)

Step by Step Solution

There are 3 Steps involved in it

Step: 1

blur-text-image

Get Instant Access to Expert-Tailored Solutions

See step-by-step solutions with expert insights and AI powered tools for academic success

Step: 2

blur-text-image

Step: 3

blur-text-image

Ace Your Homework with AI

Get the answers you need in no time with our AI-driven, step-by-step assistance

Get Started

Recommended Textbook for

General Chemisty

Authors: John E. McMurry, Robert C. Fay

2nd Edition

1269962175, 978-1269962179

More Books

Students also viewed these Chemistry questions

Question

What is Working Capital ? Explain its types.

Answered: 1 week ago

Question

2. Determine the purpose of your data visualization.

Answered: 1 week ago