Answered step by step
Verified Expert Solution
Link Copied!

Question

1 Approved Answer

Consider the following summary statistics, calculated from two independent random samples taken from normally distributed populations. Sample 1 Sample 2 = 5.961 -2 = 7.962
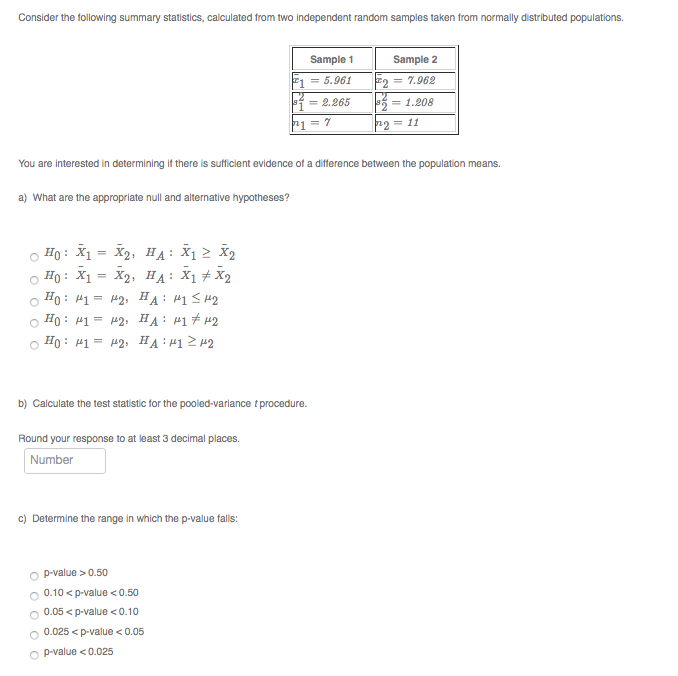
image text in transcribed
Consider the following summary statistics, calculated from two independent random samples taken from normally distributed populations. Sample 1 Sample 2 = 5.961 -2 = 7.962 = 2.265 = 1.208 n2 = 11 You are interested in determining if there is sufficient evidence of a difference between the population means. a) What are the appropriate null and alternative hypotheses? o HO: X1 = X2, HA : X1 2 X2 O HO: X1 = X2, HA : X1 # X2 o HO : #1 = #2, HA : HIS#2 o HO : #1 = 42, HA : #1 7 #2 o HO : #1 = 42, HA : #1 242 b) Calculate the test statistic for the pooled-variance t procedure. Round your response to at least 3 decimal places. Number c) Determine the range in which the p-value falls: P-value > 0.50 3 0.10

Step by Step Solution

There are 3 Steps involved in it

Step: 1

blur-text-image

Get Instant Access to Expert-Tailored Solutions

See step-by-step solutions with expert insights and AI powered tools for academic success

Step: 2

blur-text-image

Step: 3

blur-text-image

Ace Your Homework with AI

Get the answers you need in no time with our AI-driven, step-by-step assistance

Get Started

Recommended Textbook for

Elementary Technical Mathematics

Authors: Dale Ewen

12th Edition

1337630586, 978-1337630580

More Books

Students also viewed these Mathematics questions

Question

Why would the planning group use 40% more mechanics than necessary?

Answered: 1 week ago