

Answered step by step
Verified Expert Solution
Question
1 Approved Answer
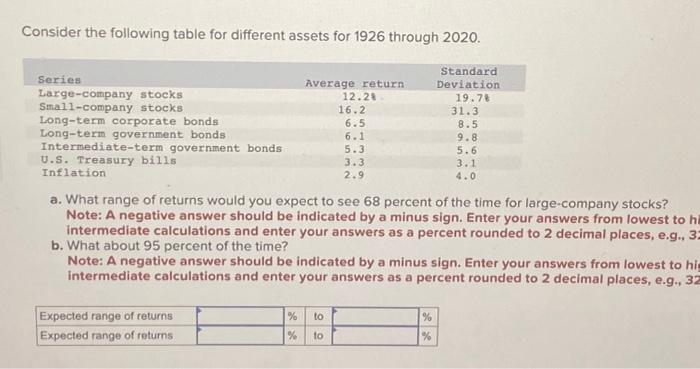
Consider the following table for different assets for 1926 through 2020. Standard Deviation 19.7% Series Large-company stocks Small-company stocks Long-term corporate bonds Long-term government bonds
Consider the following table for different assets for 1926 through 2020. Standard Deviation 19.7% Series Large-company stocks Small-company stocks Long-term corporate bonds Long-term government bonds Intermediate-term government bonds U.S. Treasury bills Inflation Expected range of returns Expected range of returns Average return % % a. What range of returns would you expect to see 68 percent of the time for large-company stocks? Note: A negative answer should be indicated by a minus sign. Enter your answers from lowest to hi intermediate calculations and enter your answers as a percent rounded to 2 decimal places, e.g., 32 b. What about 95 percent of the time? Note: A negative answer should be indicated by a minus sign. Enter your answers from lowest to hig intermediate calculations and enter your answers as a percent rounded to 2 decimal places, e.g., 32 to 12.2% to 16.2 6.5 6.1 5.3 3.3 2.9 31.3 8.5 9.8 5.6 3.1 4.0 % %
Step by Step Solution
There are 3 Steps involved in it
Step: 1

Get Instant Access to Expert-Tailored Solutions
See step-by-step solutions with expert insights and AI powered tools for academic success
Step: 2

Step: 3
Ace Your Homework with AI
Get the answers you need in no time with our AI-driven, step-by-step assistance
Get Started
Fundamentals of Investment Management
Authors: Geoffrey Hirt, Stanley Block
10th edition
0078034620, 978-0078034626