Answered step by step
Verified Expert Solution
Question
1 Approved Answer
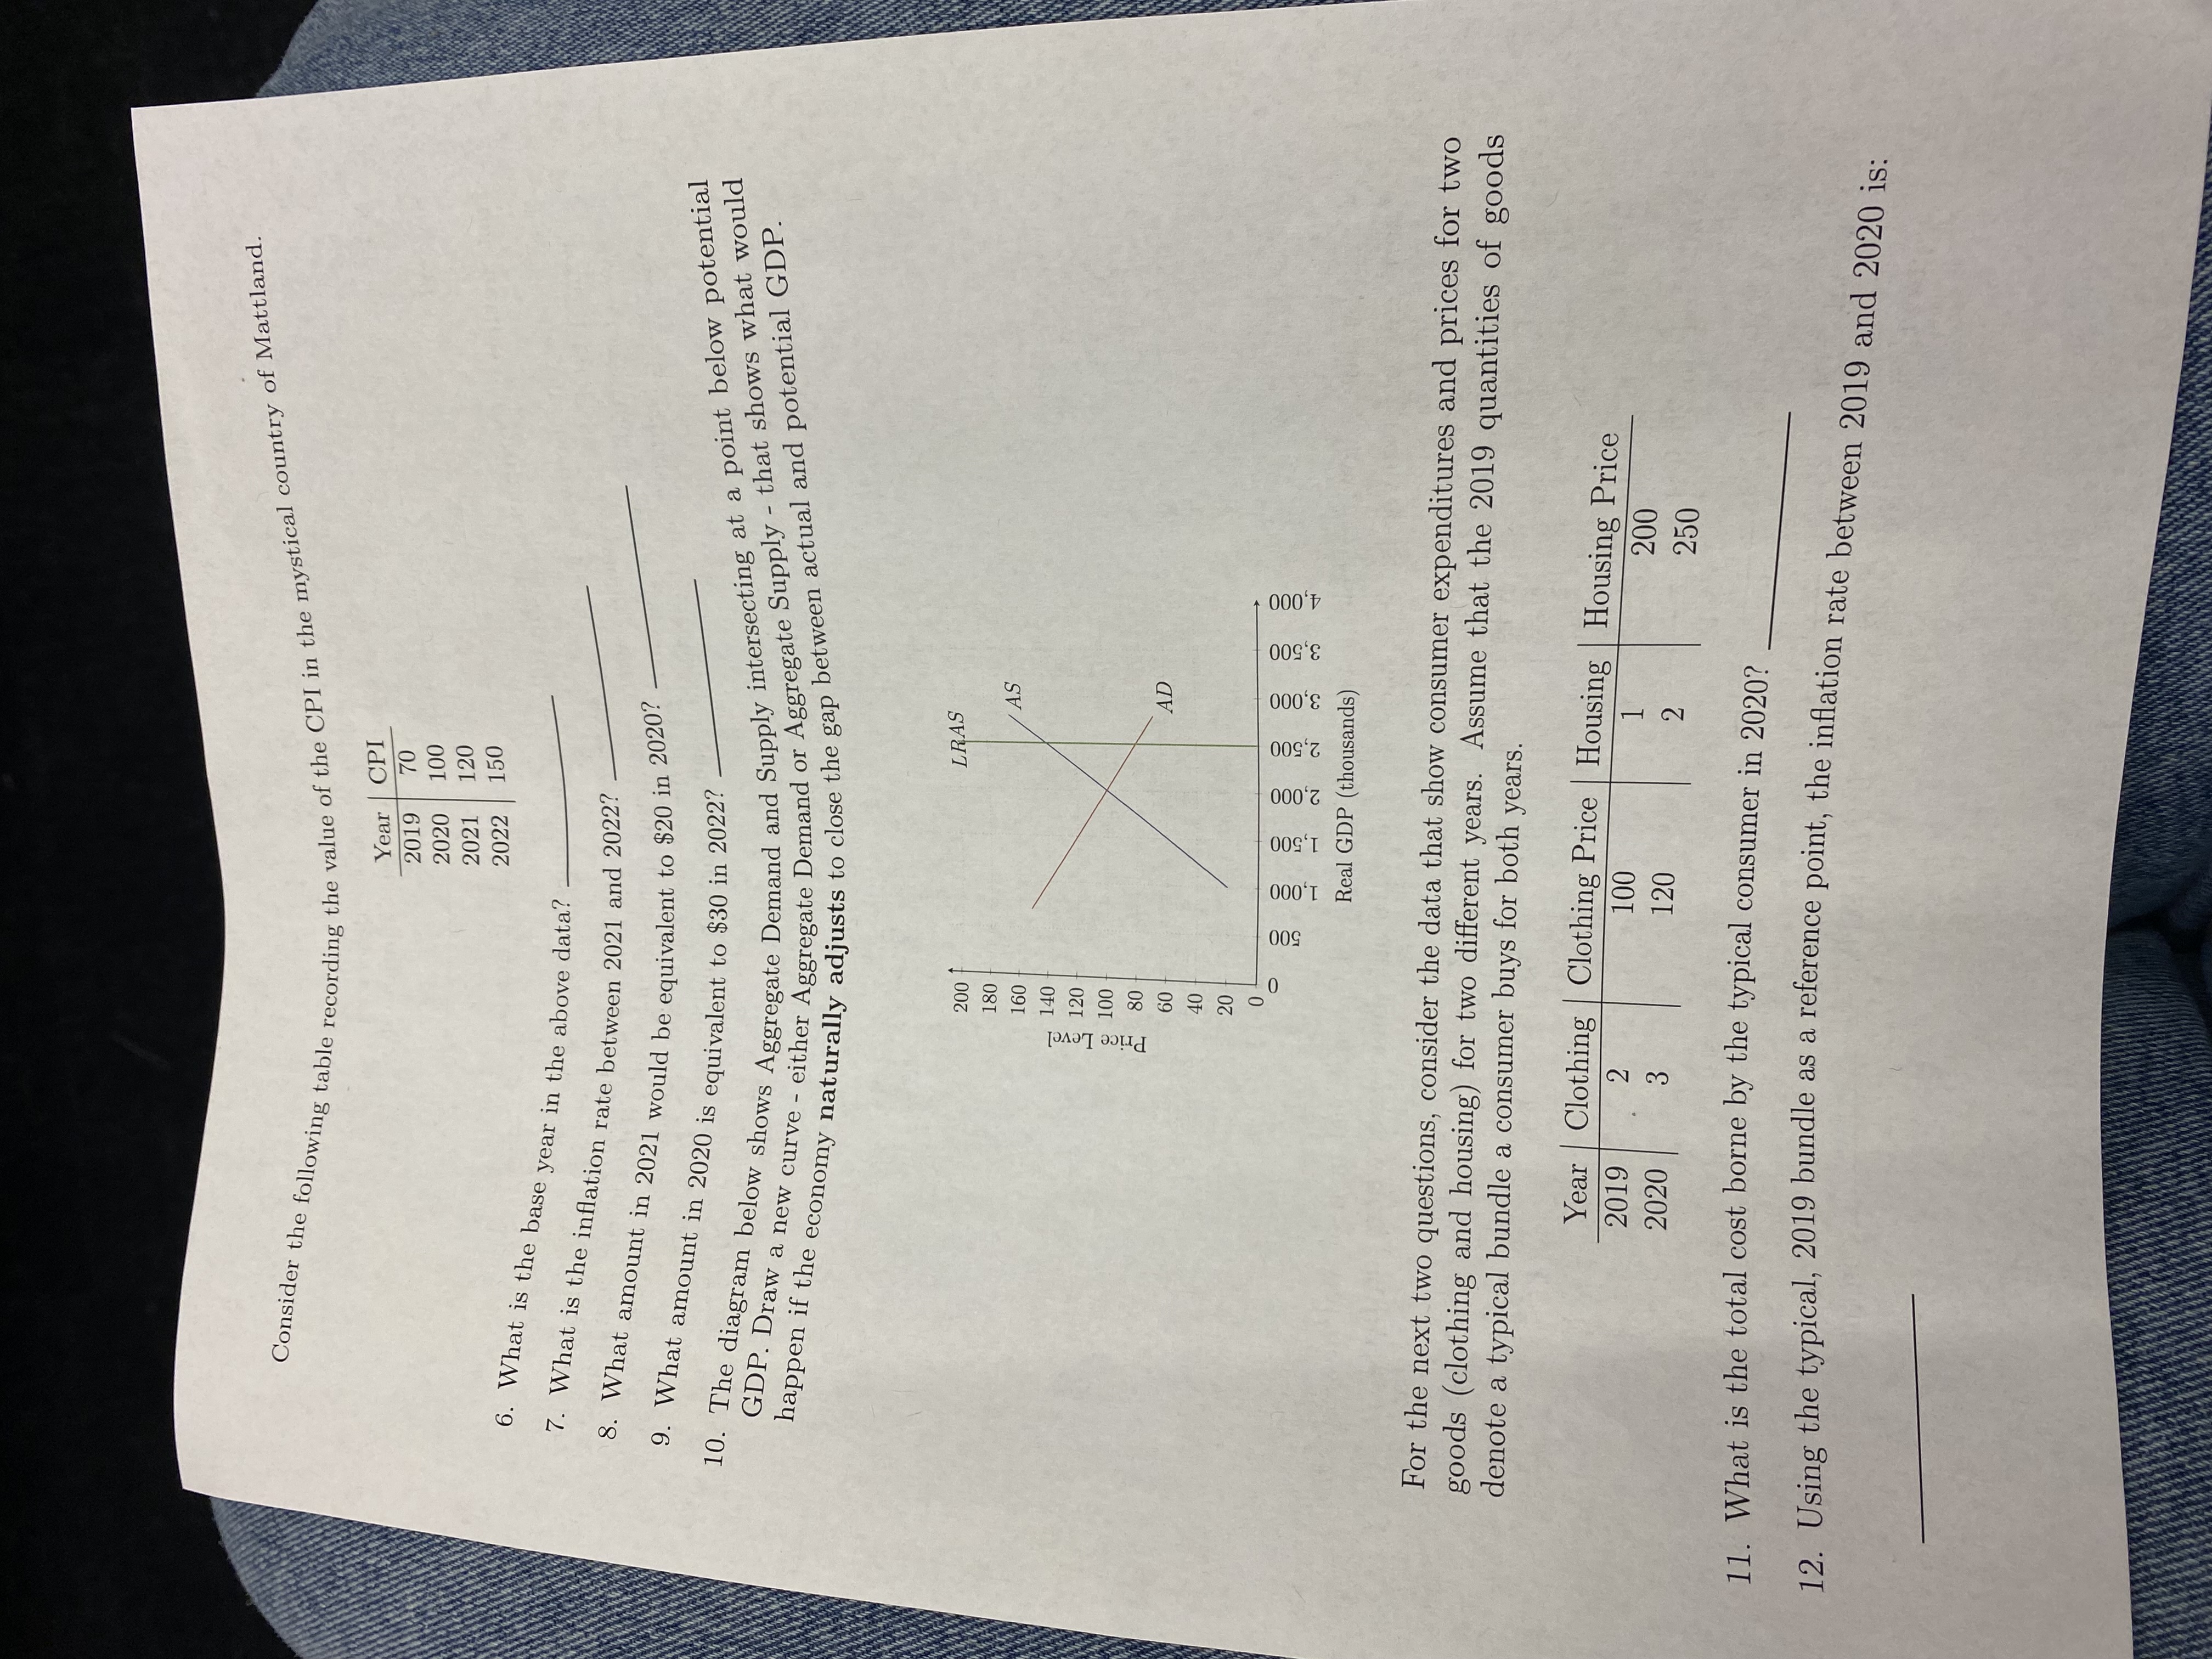
Consider the following table recording the value of the CPI in the mystical country of Mattland. 6. What is the base year in the

Consider the following table recording the value of the CPI in the mystical country of Mattland. 6. What is the base year in the above data? Year CPI 2019 70 100 2020 2021 120 2022 150 7. What is the inflation rate between 2021 and 2022? 8. What amount in 2021 would be equivalent to $20 in 2020? 9. What amount in 2020 is equivalent to $30 in 2022? 10. The diagram below shows Aggregate Demand and Supply intersecting at a point below potential happen if the economy naturally adjusts to close the gap between actual and potential GDP. GDP. Draw a new curve either Aggregate Demand or Aggregate Supply - that shows what would Price Level 200 180 160 140 120 100 80 60 40 20 0 0 500 1,000 1,500 2,000 LRAS AS AD 2,500 3,000 3,500 4,000 Real GDP (thousands) For the next two questions, consider the data that show consumer expenditures and prices for two goods (clothing and housing) for two different years. Assume that the 2019 quantities of goods denote a typical bundle a consumer buys for both years. Year Clothing Clothing Price Clothing Price Housing Housing Price 2019 2 100 1 200 2020 3 120 2 250 11. What is the total cost borne by the typical consumer in 2020? 12. Using the typical, 2019 bundle as a reference point, the inflation rate between 2019 and 2020 is:
Step by Step Solution
There are 3 Steps involved in it
Step: 1
6 What is the base year used in the above chart The base year used in the chart appears to be 2019 a...
Get Instant Access to Expert-Tailored Solutions
See step-by-step solutions with expert insights and AI powered tools for academic success
Step: 2

Step: 3

Ace Your Homework with AI
Get the answers you need in no time with our AI-driven, step-by-step assistance
Get Started


