Question
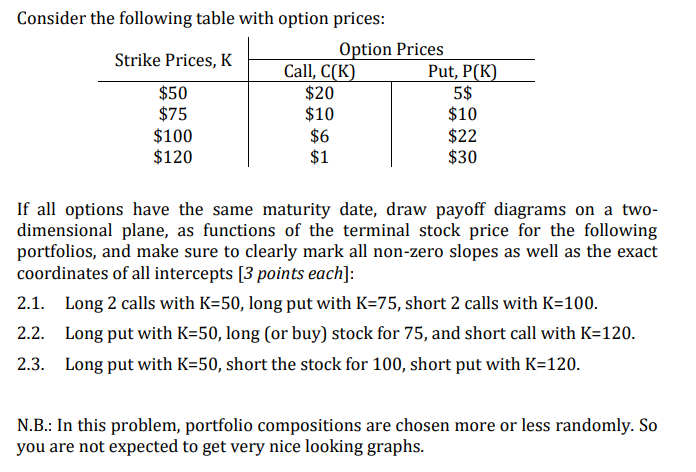
Consider the following table with option prices: Strike Prices, K Option Prices Call, C(K) Put, P(K) $50 $20 5$ $75 $10 $10 $100 $6 $22
Consider the following table with option prices: Strike Prices, K Option Prices Call, C(K) Put, P(K) $50 $20 5$ $75 $10 $10 $100 $6 $22 $120 $1 $30 If all options have the same maturity date, draw payoff diagrams on a twodimensional plane, as functions of the terminal stock price for the following portfolios, and make sure to clearly mark all non-zero slopes as well as the exact coordinates of all intercepts [3 points each]: 2.1. Long 2 calls with K=50, long put with K=75, short 2 calls with K=100. 2.2. Long put with K=50, long (or buy) stock for 75, and short call with K=120. 2.3. Long put with K=50, short the stock for 100, short put with K=120. N.B.: In this problem, portfolio compositions are chosen more or less randomly. So you are not expected to get very nice looking graphs. 
Step by Step Solution
There are 3 Steps involved in it
Step: 1

Get Instant Access to Expert-Tailored Solutions
See step-by-step solutions with expert insights and AI powered tools for academic success
Step: 2

Step: 3

Ace Your Homework with AI
Get the answers you need in no time with our AI-driven, step-by-step assistance
Get Started


