Answered step by step
Verified Expert Solution
Link Copied!

Question

1 Approved Answer

Consider the following time series: t Yt 1 1,234 2 1.201 3 1,103 4 987 5 945 6 891 7 817 8 734 The time
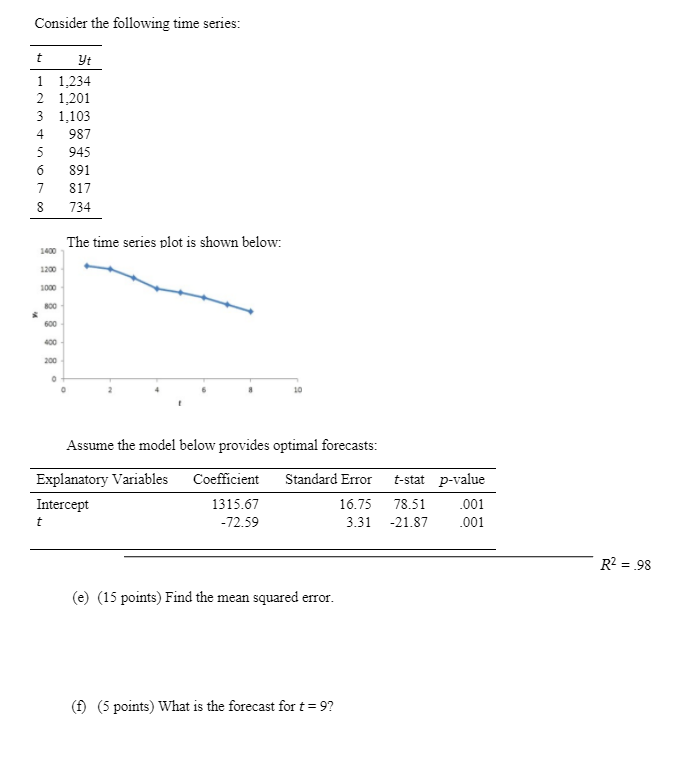
image text in transcribed

Consider the following time series: t Yt 1 1,234 2 1.201 3 1,103 4 987 5 945 6 891 7 817 8 734 The time series plot is shown below: 1400 1200 1000 600 400 200 Assume the model below provides optimal forecasts: Explanatory Variables Intercept Coefficient 1315.67 -72.59 Standard Error 16.75 3.31 t-stat p-value 78.51 .001 -21.87 .001 t R2 = 98 (e) (15 points) Find the mean squared error. (f) (5 points) What is the forecast for t=9

Step by Step Solution

There are 3 Steps involved in it

Step: 1

blur-text-image

Get Instant Access to Expert-Tailored Solutions

See step-by-step solutions with expert insights and AI powered tools for academic success

Step: 2

blur-text-image_2

Step: 3

blur-text-image_3

Ace Your Homework with AI

Get the answers you need in no time with our AI-driven, step-by-step assistance

Get Started

Recommended Textbook for

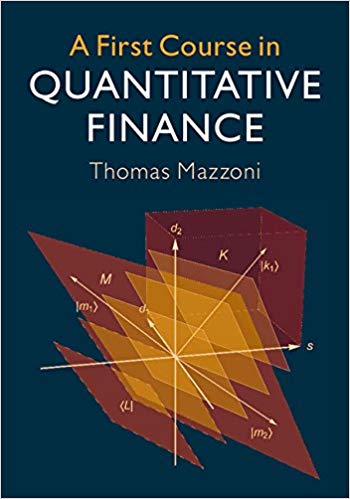
A First Course in Quantitative Finance

Authors: Thomas Mazzoni

1st edition

9781108411431, 978-1108419574

More Books

Students also viewed these Finance questions

Question

I leave small-group meetings early. RARELY 1 2 3 4 5 ALMOST ALWAYS

Answered: 1 week ago