Answered step by step
Verified Expert Solution
Question
1 Approved Answer
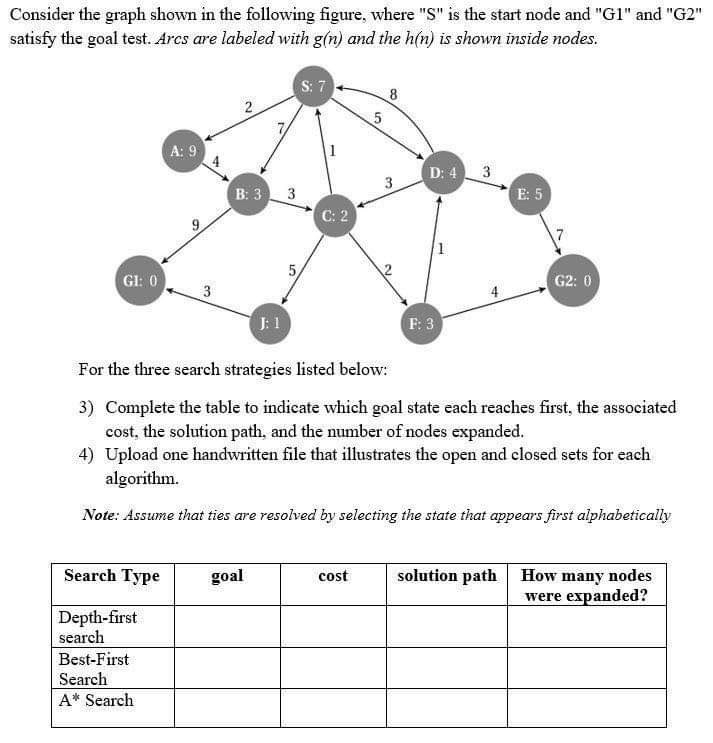
Consider the graph shown in the following figure, where S is the start node and G 1 and G 2
Consider the graph shown in the following figure, where S is the start node and G and G satisfy the goal test. Arcs are labeled with and the is shown inside nodes.
For the three search strategies listed below:
Complete the table to indicate which goal state each reaches first, the associated cost, the solution path, and the number of nodes expanded.
Upload one handwritten file that illustrates the open and closed sets for each algorithm.
Note: Assume that ties are resolved by selecting the state that appears first alphabetically
tableSearch Type,goal,cost,solution path,tableHow many nodeswere expanded?tableDepthfirstsearchtableBestFirstSearch Search,,,,

Step by Step Solution
There are 3 Steps involved in it
Step: 1

Get Instant Access to Expert-Tailored Solutions
See step-by-step solutions with expert insights and AI powered tools for academic success
Step: 2

Step: 3

Ace Your Homework with AI
Get the answers you need in no time with our AI-driven, step-by-step assistance
Get Started


