

Question
Consider the investment demand (ID) curve on the following graph. Initially, the interest rate is 3% and the quantity of investment demanded is $460 billion.
Consider the investment demand (ID) curve on the following graph.
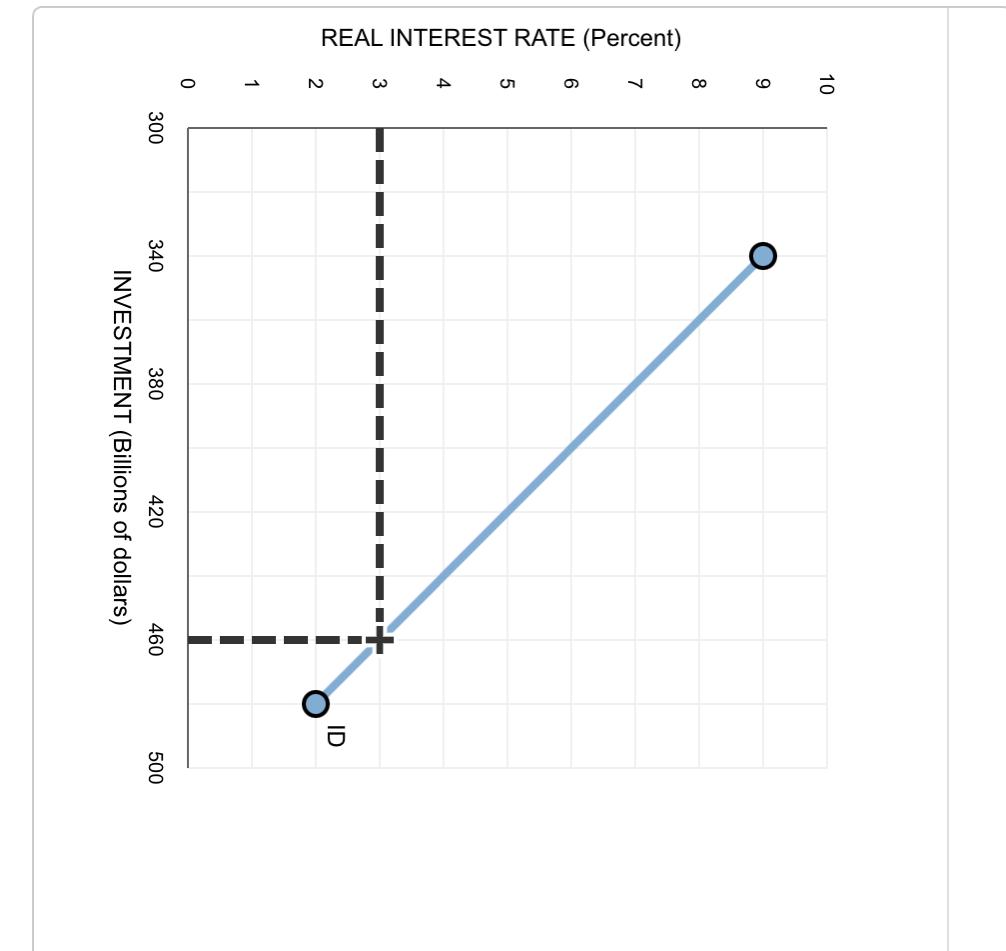
Initially, the interest rate is 3% and the quantity of investment demanded is $460 billion. Suppose an increase in the public debt causes the interest rate to rise from 3% to 6%. The increase in the public debt crowds out ______$40 billion, $30 billion, $100 billion, or $60 billion_________ of private investment. (Assume that the increase in the public debt does not affect the position of the investment demand curve.)
Consider two identical economies, economy A and economy B, both of which are producing close to their full employment output levels. The governments in economies A and B both increase the size of their national debts by the same amount. The government in economy A takes on the additional debt to provide free concerts and firework displays for its citizens. The government in economy B takes on the additional debt in order to improve its highways. The crowding-out effect of the increase in public debt will cause the future capital stock in economy A to fall by a ________smaller or larger________ amount than the future capital stock in economy B.
REAL INTEREST RATE (Percent) 10 9 8 4 3 2 1 0 300 340 380 420 460 INVESTMENT (Billions of dollars) ID 500Step by Step Solution
There are 3 Steps involved in it
Step: 1

Get Instant Access to Expert-Tailored Solutions
See step-by-step solutions with expert insights and AI powered tools for academic success
Step: 2

Step: 3
Ace Your Homework with AI
Get the answers you need in no time with our AI-driven, step-by-step assistance
Get Started
Sustainability In Energy Business And Finance Approaches And Developments In The Energy Market
Authors: Hasan Dinçer , Serhat Yüksel
1st Edition
3030940500,3030940519