Answered step by step
Verified Expert Solution
Link Copied!

Question

1 Approved Answer

Consider the market below. a. Suppose there is a $1.50 per unit tax levied on sellers. Draw the after-tax supply curve. Instructions: Use the tool
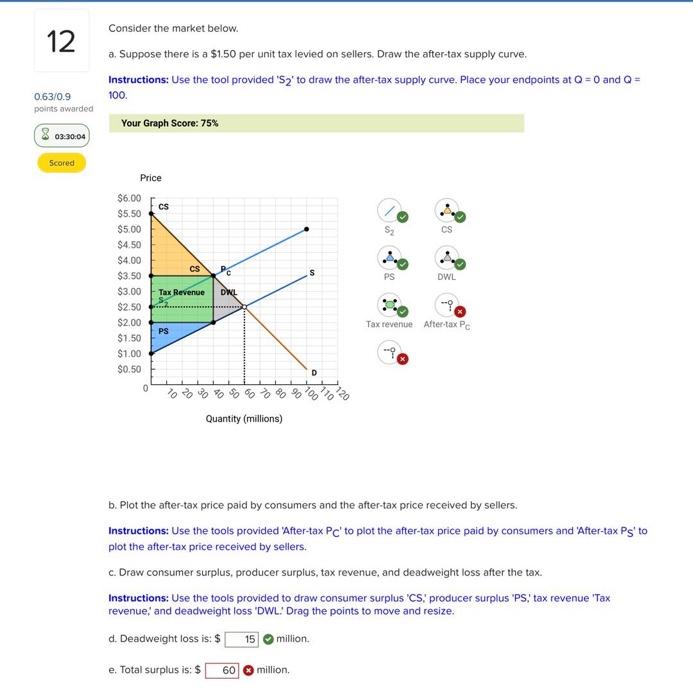
image text in transcribed
Consider the market below. a. Suppose there is a $1.50 per unit tax levied on sellers. Draw the after-tax supply curve. Instructions: Use the tool provided ' S2 ' to draw the after-tax supply curve. Place your endpoints at Q=0 and Q= 100. Your Graph Score: 75% b. Plot the after-tax price paid by consumers and the after-tax price received by sellers. Instructions: Use the tools provided 'After-tax PCC to plot the after-tax price paid by consumers and 'After-tax PSS ' to plot the after-tax price received by sellers. c. Draw consumer surplus, producer surplus, tax revenue, and deadweight loss after the tax. Instructions: Use the tools provided to draw consumer surplus 'CS;', producer surplus 'PS;', tax revenue 'Tax revenue,' and deadweight loss 'DWL.' Drag the points to move and resize. d. Deadweight loss is: \$ million. e. Total surplus is: $ ( ) million

Step by Step Solution

There are 3 Steps involved in it

Step: 1

blur-text-image

Get Instant Access to Expert-Tailored Solutions

See step-by-step solutions with expert insights and AI powered tools for academic success

Step: 2

blur-text-image

Step: 3

blur-text-image

Ace Your Homework with AI

Get the answers you need in no time with our AI-driven, step-by-step assistance

Get Started

Recommended Textbook for

I Love My Awesome Auditor

Authors: Lovely Hearts Publishing

1st Edition

1794298169, 978-1794298163

More Books

Students also viewed these Accounting questions

Question

List and explain the three kinds of pricing methods.

Answered: 1 week ago

Question

Distinguish between filtering and interpreting. (Objective 2)

Answered: 1 week ago