

Answered step by step
Verified Expert Solution
Question
1 Approved Answer
Consider the market for mountain bikes. The following graph shows the demand and supply for mountain bikes before the government imposes any taxes. First, use
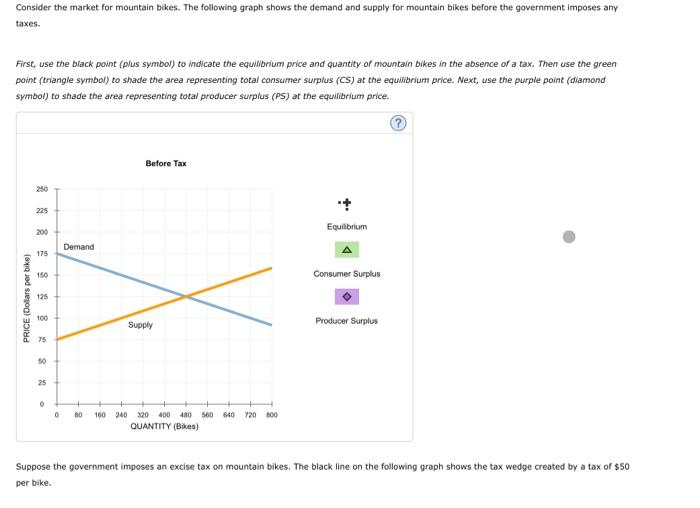
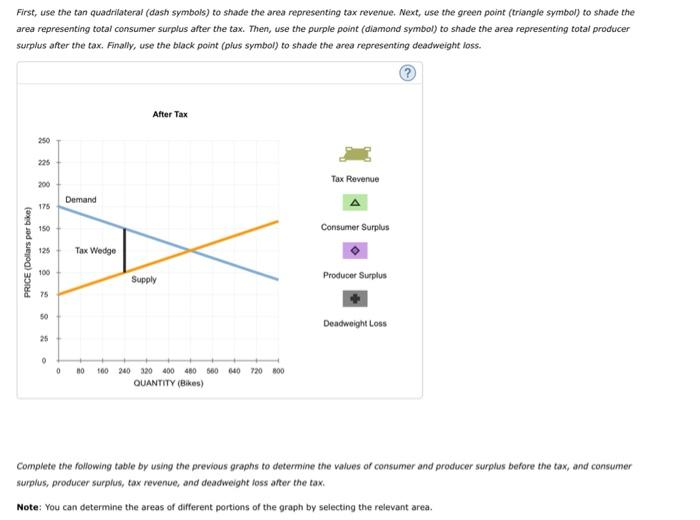
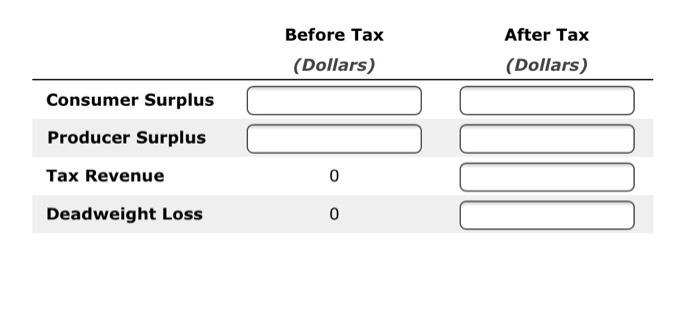 Consider the market for mountain bikes. The following graph shows the demand and supply for mountain bikes before the government imposes any taxes. First, use the black point (plus symbol) to indicate the equilibrium price and quantity of mountain bikes in the absence of a tax. Then use the green point (triangle symbol) to shade the area representing total consumer surplus (CS) at the equilibrium price. Next, use the purple point (diamond symbol) to shade the area representing total producer surplus (PS) at the equilibrium price. Before Tax 250 225 Equilibrium 200 Demand 175 150 Consumer Surplus PRICE (Dolars per bike) 125 100 Supply Producer Surplus 75 50 25 0 + 0 720 000 160 240 320 400 480 560 640 QUANTITY (Bikes) Suppose the government imposes an excise tax on mountain bikes. The black line on the following graph shows the tax wedge created by a tax of $50 per bike. First, use the tan quadrilateral (dash symbols) to shade the area representing tax revenue. Next, use the green point (triangle symbol) to shade the area representing total consumer surplus after the tax. Then, use the purple point (diamond symbol) to shade the area representing total producer surplus after the tax. Finally, use the black point (plus symbol) to shade the area representing deadweight loss. After Tax 250 225 200 Tax Revenue Demand 175 A 150 Consumer Surplus PRICE (Dollars per bike) 125 Tax Wedge 100 Supply Producer Surplus 75 50 Deadweight Loss 25 0 0 10 100 240 320 400 480 560 640 720 800 QUANTITY (Bikes) Complete the following table by using the previous graphs to determine the values of consumer and producer surplus before the tax, and consumer surplus, producer surplus, tax revenue, and deadweight loss after the tax. Note: You can determine the areas of different portions of the graph by selecting the relevant area. Before Tax (Dollars) After Tax (Dollars) Consumer Surplus Producer Surplus Tax Revenue 0 Deadweight Loss 0
Step by Step Solution
There are 3 Steps involved in it
Step: 1

Get Instant Access to Expert-Tailored Solutions
See step-by-step solutions with expert insights and AI powered tools for academic success
Step: 2

Step: 3
Ace Your Homework with AI
Get the answers you need in no time with our AI-driven, step-by-step assistance
Get Started
Eoc Only Davis Managerial Accounting
Authors: Charles E. Davis, Elizabeth Davis
2nd Edition
111883464X, 978-1118834640