Answered step by step
Verified Expert Solution
Question
1 Approved Answer
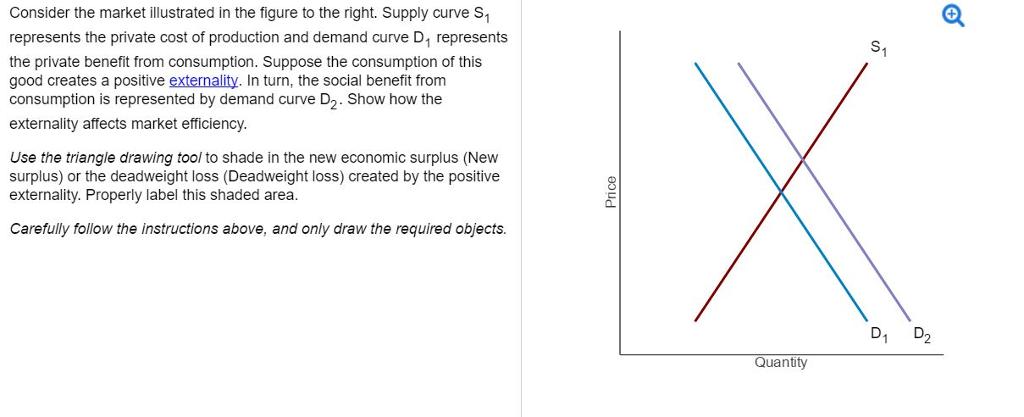
. Consider the market illustrated in the figure to the right. Supply curve S, represents the private cost of production and demand curve D, represents
 .
.
Consider the market illustrated in the figure to the right. Supply curve S, represents the private cost of production and demand curve D, represents the private benefit from consumption. Suppose the consumption of this good creates a positive externality. In turn, the social benefit from consumption is represented by demand curve D2. Show how the externality affects market efficiency. Use the triangle drawing tool to shade in the new economic surplus (New surplus) or the deadweight loss (Deadweight loss) created by the positive externality. Properly label this shaded area. Carefully follow the instructions above, and only draw the required objects. D, D2 Quantity
Step by Step Solution
★★★★★
3.37 Rating (153 Votes )
There are 3 Steps involved in it
Step: 1
The market quantity is Q1 that is the quantity corresponding to the intersection ...
Get Instant Access to Expert-Tailored Solutions
See step-by-step solutions with expert insights and AI powered tools for academic success
Step: 2

Step: 3

Ace Your Homework with AI
Get the answers you need in no time with our AI-driven, step-by-step assistance
Get Started


