Answered step by step
Verified Expert Solution
Question
1 Approved Answer
Consider the monthly continuously compounded returns on Amazon stock and the Dow Jones industrial average computed using end of month closing prices over the period
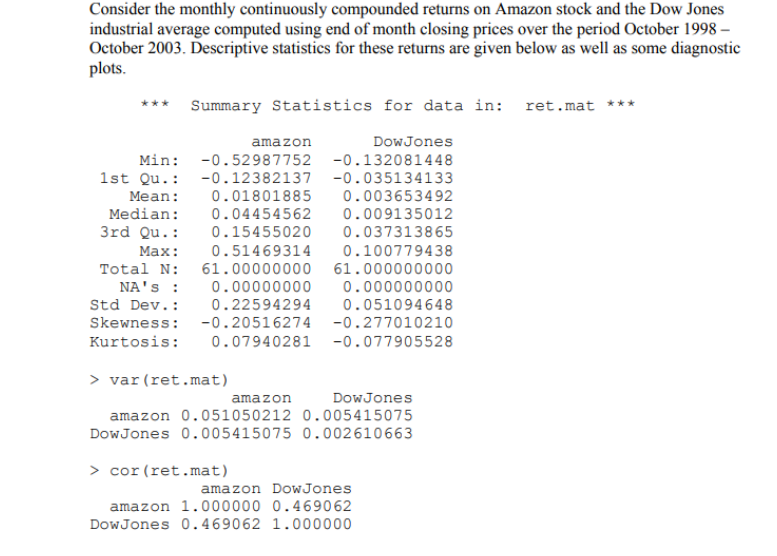
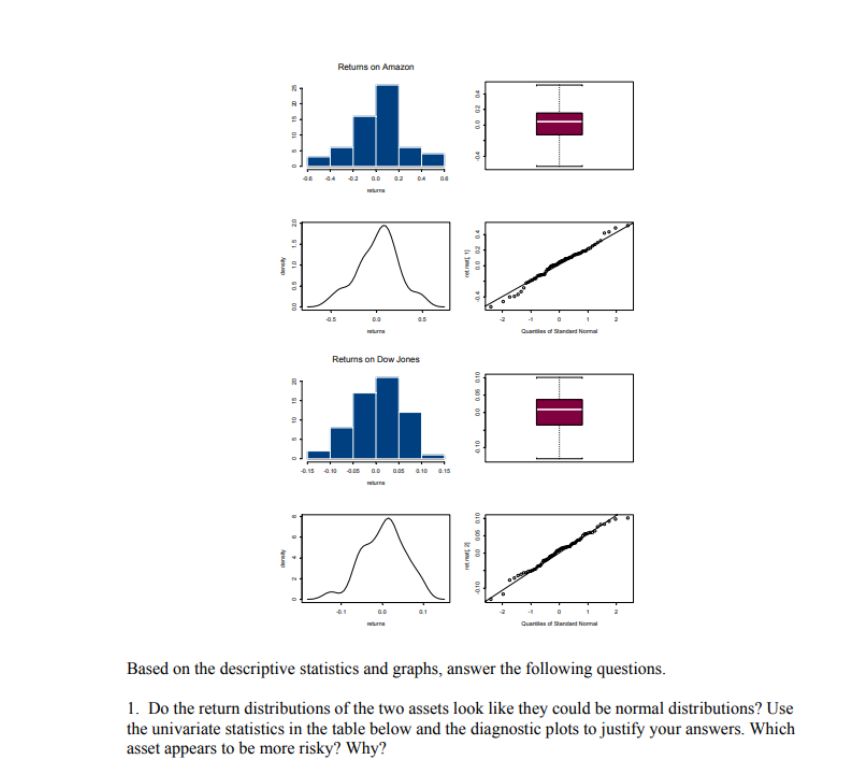
Consider the monthly continuously compounded returns on Amazon stock and the Dow Jones industrial average computed using end of month closing prices over the period October 1998 October 2003. Descriptive statistics for these returns are given below as well as some diagnostic plots. Based on the 1. Do the return distributions of the two assets look like they could be normal distributions? Use the univariate statistics in the table below and the diagnostic plots to justify your answers. Which asset appears to be more risky? Why? Consider the monthly continuously compounded returns on Amazon stock and the Dow Jones industrial average computed using end of month closing prices over the period October 1998 October 2003. Descriptive statistics for these returns are given below as well as some diagnostic plots. Based on the 1. Do the return distributions of the two assets look like they could be normal distributions? Use the univariate statistics in the table below and the diagnostic plots to justify your answers. Which asset appears to be more risky? Why
Step by Step Solution
There are 3 Steps involved in it
Step: 1
Get Instant Access to Expert-Tailored Solutions
See step-by-step solutions with expert insights and AI powered tools for academic success
Step: 2
Step: 3
Ace Your Homework with AI
Get the answers you need in no time with our AI-driven, step-by-step assistance
Get Started