

Question
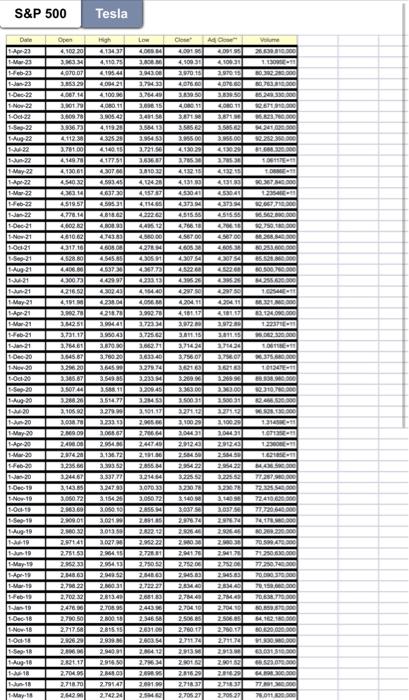
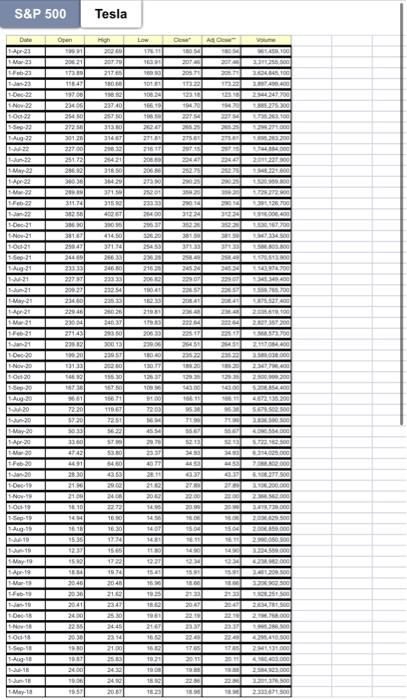
Consider the monthly stock information of the Standard and Poors 500 Composite index and Tesla (tick symbol TSLA) from May 1, 2018, to April 1,
Consider the monthly stock information of the Standard and Poors 500 Composite index and Tesla (tick symbol TSLA) from May 1, 2018, to April 1, 2023.Download H
USE THE DATA IN THE IMAGE
Compute the returns of S&P 500 and Tesla and report the statistics (including arithmetic average return, geometric average return, standard deviation, minimum value, and maximum values) in the following table. (Please express the values as percentages and keep two digits after the decimal point e.g, 1.23%. Note: if your answer is 1.23%, please just enter 1.23 in the blank.)
Statistics | S&P 500 | Tesla |
Arithmetic Average Return | % | % |
Geometric Average Return | % | % |
Standard Deviation | % | % |
Minimum value | % | % |
Maximum value | % | % |
Step by Step Solution
There are 3 Steps involved in it
Step: 1

Get Instant Access to Expert-Tailored Solutions
See step-by-step solutions with expert insights and AI powered tools for academic success
Step: 2

Step: 3
Ace Your Homework with AI
Get the answers you need in no time with our AI-driven, step-by-step assistance
Get Started
Master The Art Of House Flipping
Authors: Livia V. Velez
1st Edition
979-8865806561