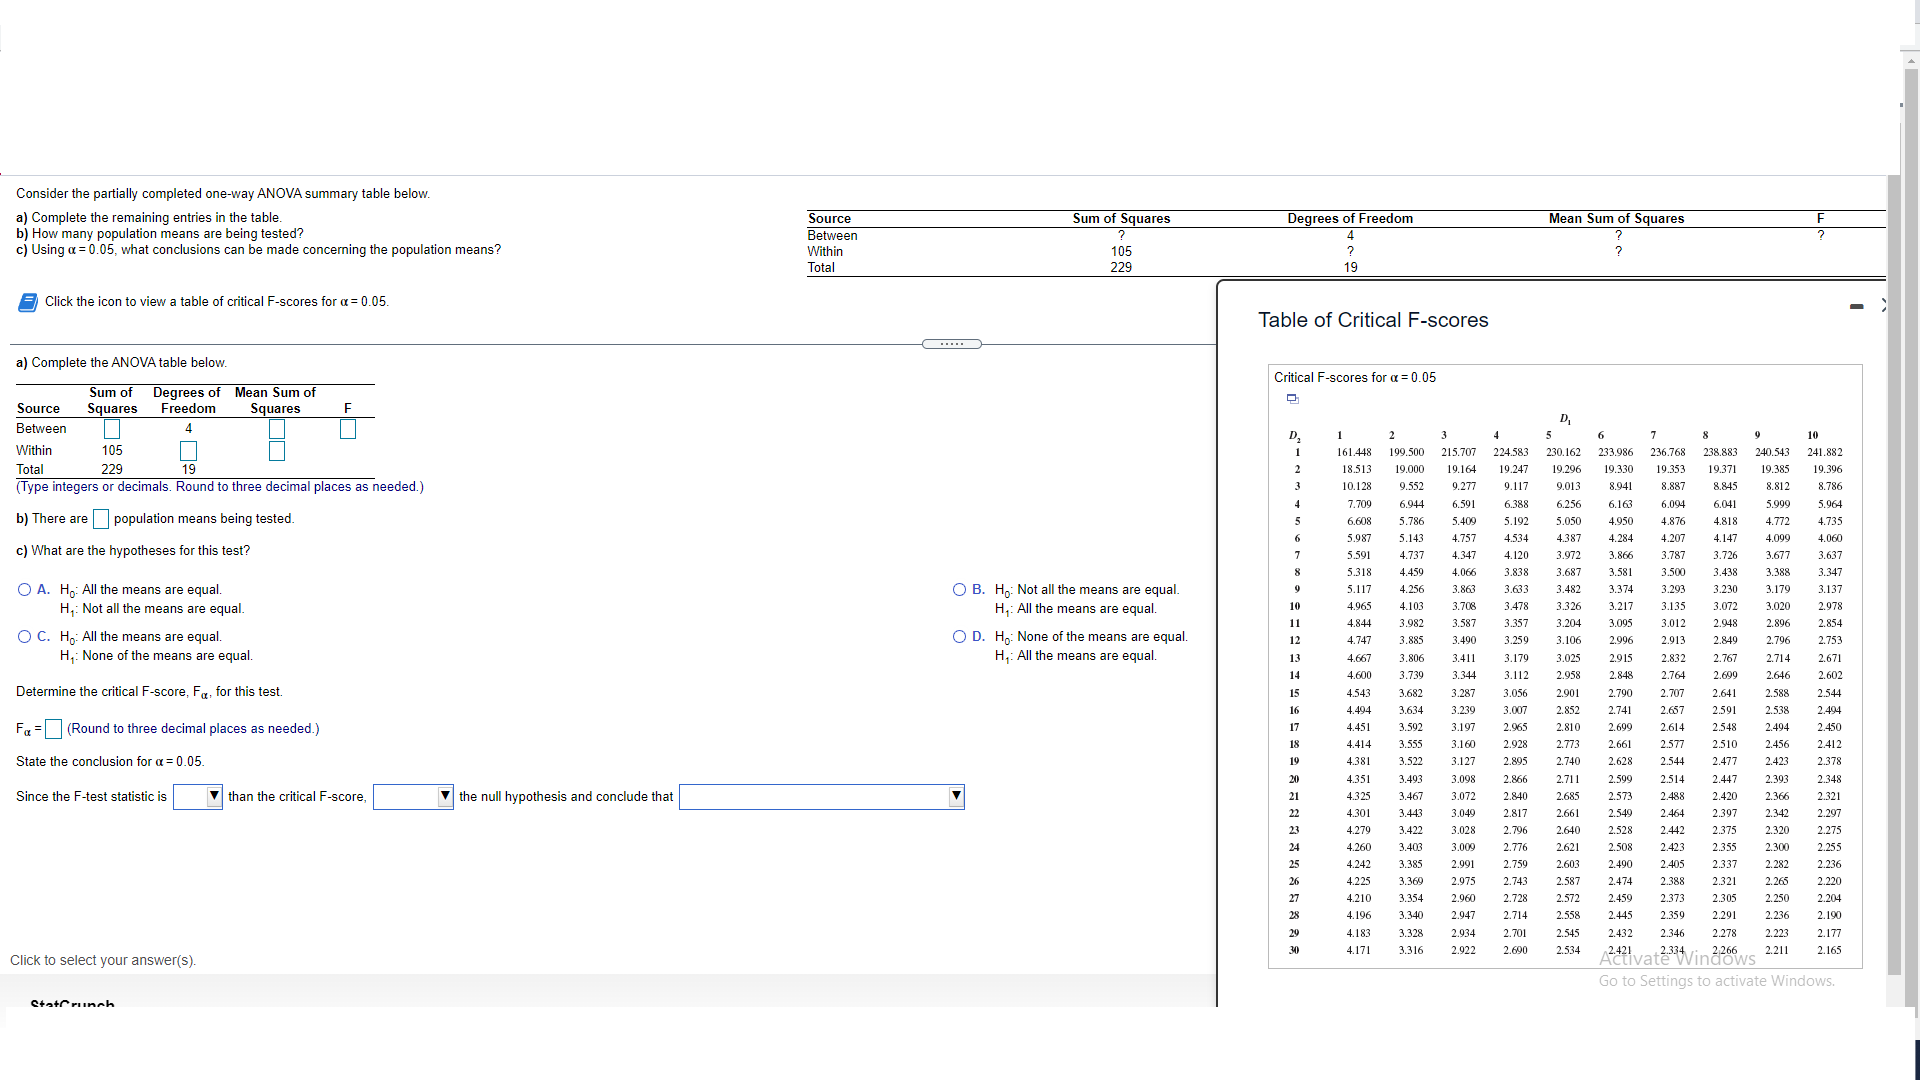
Consider the partially completed one-way ANOVA summary table below. Sum of Squares Degrees of Freedom Mean Sum of Squares Source a) Complete the remaining entries in the table. Between 105 b) How many population means are being tested? Within 229 c) Using a = 0.05, what conclusions can be made concerning the population means? Total Table of Critical F-scores Click the icon to view a table of critical F-scores for a = 0.05. Critical F-scores for a = 0.05 a) Complete the ANOVA table below. 6 7 8 10 Sum of Degrees of Mean Sum of D2 2 233.986 236.768 238.883 240.543 241.882 Source Squares Freedom Squares 161.448 199.500 215.707 224.583 230.162 19.396 19.16 19.247 19.296 19.330 19.353 19.371 9.38. 18.513 19.000 Between 8.812 8.786 0277 9.117 0.013 3.941 8.887 3.84. 0.128 9.552 5.96 Within 105 6.388 6.256 5.163 6.094 104 5.999 7.709 6.944 5.50 4.73 229 318' 1.772 Total 786 5.40 5.192 5.050 1950 4.876 (Type integers or decimals. Round to three decimal places as needed.) 6.608 4.207 4.14 4.099 4.060 5.987 5143 4.757 4.534 1387 4.284 3.72 3.677 3.637 1 34 4.120 3912 3.866 3.787 b) There are | population means being tested. 5.591 3.34 3.687 3.58 3.500 3.43 .388 5.318 4.45 1 06 3.838 3.230 3.179 3.13 5.11 4.256 3.86 3.635 3.482 3.374 3.29: c) What are the hypotheses for this test? O B. Ho: Not all the means are equal. 3.135 3.072 .020 2.97 4.96 4.10 3.70 3.478 3.326 3.217 3.012 2.948 896 2.854 H,: All the means are equal 3.587 3.357 3.204 3.095 1.844 3.982 2.849 2.796 2.753 O A. Ho: All the means are equal. 2.913 4.747 3.885 3.490 3.259 3.106 2.996 H,: Not all the means are equal. O D. Ho: None of the means are equal. 2915 2.832 2 767 2.714 2.671 1.66 3.80 3.411 3.179 3.025 H. : All the means are equal. 2.764 2.690 2.646 2.602 O C. Ho: All the means are equal. 4.601 3.344 3.112 2.958 2.848 3.739 2.790 2.707 2.641 2.588 2.544 2.901 H,: None of the means are equal. 4.543 3.68 3.287 3.056 2 85 2.741 2.59 2.538 249 4.494 3.634 3.239 3.007 2548 2.494 2450 4.45 3.592 :.197 2.965 2.810 2.699 2.614 Determine the critical F-score, Fa, for this test. 2.661 2.577 2510 2.456 2412 4.414 3.555 .160 2.928 2.773 2.477 2.423 2.378 4.381 1.522 .127 2.895 2.740 2.628 2.544 Fa =(Round to three decimal places as needed.) 2.599 2.514 2.447 2393 2.348 2.711 4.351 1.493 3.098 2.860 2.573 2 488 2.420 2.366 2.321 3.072 2.840 2.685 4.325 .467 2.397 2.342 2.297 State the conclusion for a = 0.05. 2.661 2.549 .301 1443 .049 2.464 2.817 the null hypothesis and conclude that .028 2.796 2.640 2.528 2442 2.375 2320 2.27: 4.27 422 300 2.255 Since the F-test statistic is than the critical F-score, 2.508 2.423 2,35 4.26 403 3.009 2.170 2.62 2405 2.337 2.282 2.236 2.991 2.759 2.603 2.490 4.24 385 2.321 2.265 2.220 4.22 260 2.975 2.743 2 587 2474 2.388 2.572 2.459 2.373 2.30 2.250 2.20 4.210 .354 2.960 2.728 2558 2.445 2.359 2.291 2.236 2.19 4.19 340 2.947 2.714 2.346 2.278 2.223 2.177 3.328 2.934 2,701 2.545 2.432 4.18 2.211 2.16 1316 2.922 2.690 2.534 17 Activate Windows Go to Settings to activate Windows. Click to select your answer(s). Statfrench


