

Question
Consider the rest of the world with free trade (production at and consumption at ), as shown in the graph on the right in Figure
-
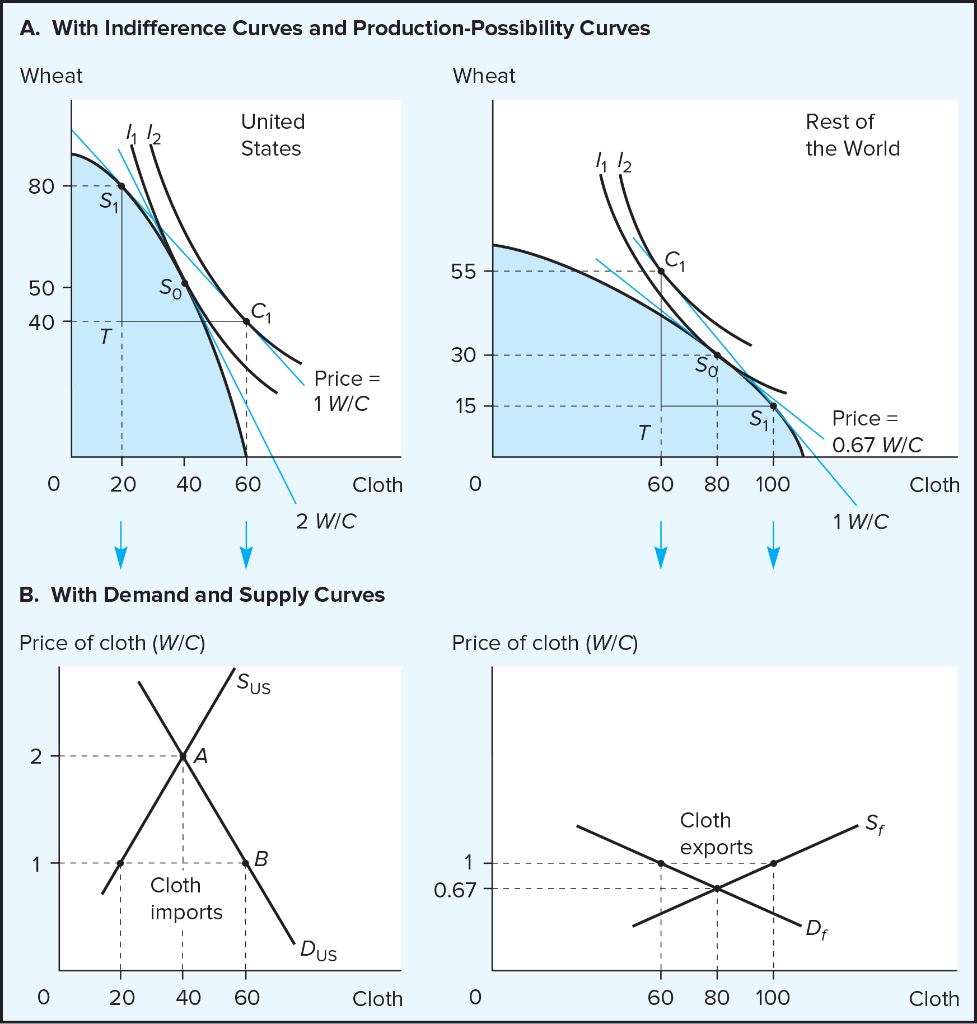
Consider the rest of the world with free trade (production at and consumption at ), as shown in the graph on the right in Figure 4.4A. of your textbook. The international relative price of cloth now changes to 1.3 W/C.
-
Using a graph, show the effects of this change in the international relative price on production and consumption in the rest of the world.
-
Is this change in the international relative price an improvement or deterioration in the terms of trade of the rest of the world? According to your graph, does the rest of the world gain or lose well-being? Explain
-
Step by Step Solution
There are 3 Steps involved in it
Step: 1

Get Instant Access to Expert-Tailored Solutions
See step-by-step solutions with expert insights and AI powered tools for academic success
Step: 2

Step: 3
Ace Your Homework with AI
Get the answers you need in no time with our AI-driven, step-by-step assistance
Get Started
Advanced Finance Theories
Authors: Ser-Huang Poon
1st Edition
9814460370, 978-9814460378