

Question
Consider the returns of the MSCI index of developed markets equity in the Excel file. Given the returns over the 1988-2013 period, and the arithmetic
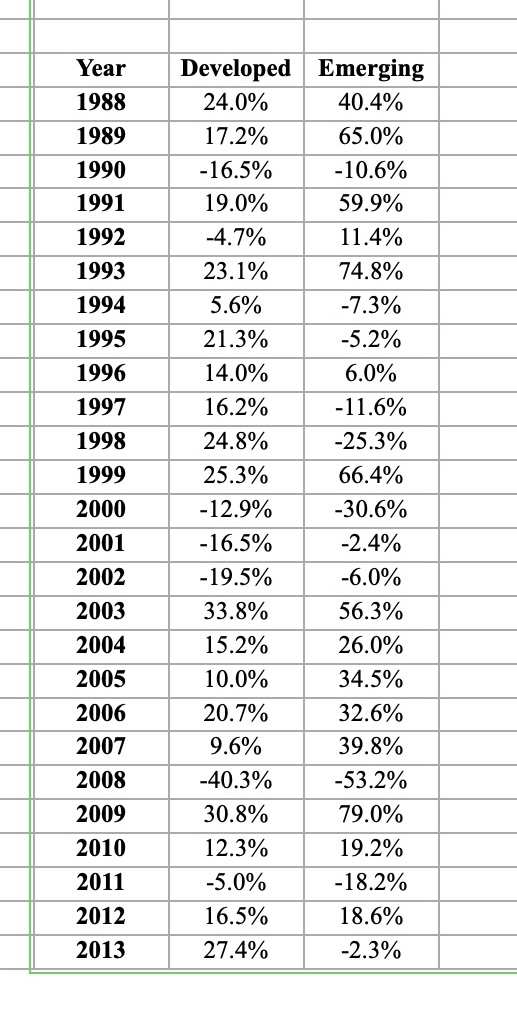
Consider the returns of the MSCI index of developed markets equity in the Excel file. Given the returns over the 1988-2013 period, and the arithmetic mean return and volatility you calculated in the first quiz (which you could also recalculate now if necessary), what has been the quick-and-dirty risk-adjusted return of these markets?
possible answers
0.99
0.54
0.72
0.89
0.21
\begin{tabular}{||c|c|c|c|} \hline & & & \\ \hline Year & Developed & Emerging & \\ \hline 1988 & 24.0% & 40.4% & \\ \hline 1989 & 17.2% & 65.0% & \\ \hline 1990 & 16.5% & 10.6% & \\ \hline 1991 & 19.0% & 59.9% & \\ \hline 1992 & 4.7% & 11.4% & \\ \hline 1993 & 23.1% & 74.8% & \\ \hline 1994 & 5.6% & 7.3% & \\ \hline 1995 & 21.3% & 5.2% & \\ \hline 1996 & 14.0% & 6.0% & \\ \hline 1997 & 16.2% & 11.6% & \\ \hline 1998 & 24.8% & 25.3% & \\ \hline 1999 & 25.3% & 66.4% & \\ \hline 2000 & 12.9% & 30.6% & \\ \hline 2001 & 16.5% & 2.4% & \\ \hline 2002 & 19.5% & 6.0% & \\ \hline 2003 & 33.8% & 56.3% & \\ \hline 2004 & 15.2% & 26.0% & \\ \hline 2005 & 10.0% & 34.5% & \\ \hline 2006 & 20.7% & 32.6% & \\ \hline 2007 & 9.6% & 39.8% & \\ \hline 2008 & 40.3% & 53.2% & \\ \hline 2009 & 30.8% & 79.0% & \\ \hline 2010 & 12.3% & 19.2% & \\ \hline 2011 & 5.0% & 18.2% & \\ \hline 2012 & 16.5% & 18.6% & \\ \hline 2013 & 27.4% & 2.3% & \\ \hline \end{tabular} \begin{tabular}{||c|c|c|c|} \hline & & & \\ \hline Year & Developed & Emerging & \\ \hline 1988 & 24.0% & 40.4% & \\ \hline 1989 & 17.2% & 65.0% & \\ \hline 1990 & 16.5% & 10.6% & \\ \hline 1991 & 19.0% & 59.9% & \\ \hline 1992 & 4.7% & 11.4% & \\ \hline 1993 & 23.1% & 74.8% & \\ \hline 1994 & 5.6% & 7.3% & \\ \hline 1995 & 21.3% & 5.2% & \\ \hline 1996 & 14.0% & 6.0% & \\ \hline 1997 & 16.2% & 11.6% & \\ \hline 1998 & 24.8% & 25.3% & \\ \hline 1999 & 25.3% & 66.4% & \\ \hline 2000 & 12.9% & 30.6% & \\ \hline 2001 & 16.5% & 2.4% & \\ \hline 2002 & 19.5% & 6.0% & \\ \hline 2003 & 33.8% & 56.3% & \\ \hline 2004 & 15.2% & 26.0% & \\ \hline 2005 & 10.0% & 34.5% & \\ \hline 2006 & 20.7% & 32.6% & \\ \hline 2007 & 9.6% & 39.8% & \\ \hline 2008 & 40.3% & 53.2% & \\ \hline 2009 & 30.8% & 79.0% & \\ \hline 2010 & 12.3% & 19.2% & \\ \hline 2011 & 5.0% & 18.2% & \\ \hline 2012 & 16.5% & 18.6% & \\ \hline 2013 & 27.4% & 2.3% & \\ \hline \end{tabular}Step by Step Solution
There are 3 Steps involved in it
Step: 1

Get Instant Access to Expert-Tailored Solutions
See step-by-step solutions with expert insights and AI powered tools for academic success
Step: 2

Step: 3
Ace Your Homework with AI
Get the answers you need in no time with our AI-driven, step-by-step assistance
Get Started
Investments An Introduction
Authors: Herbert B Mayo
9th Edition
324561385, 978-0324561388