Question
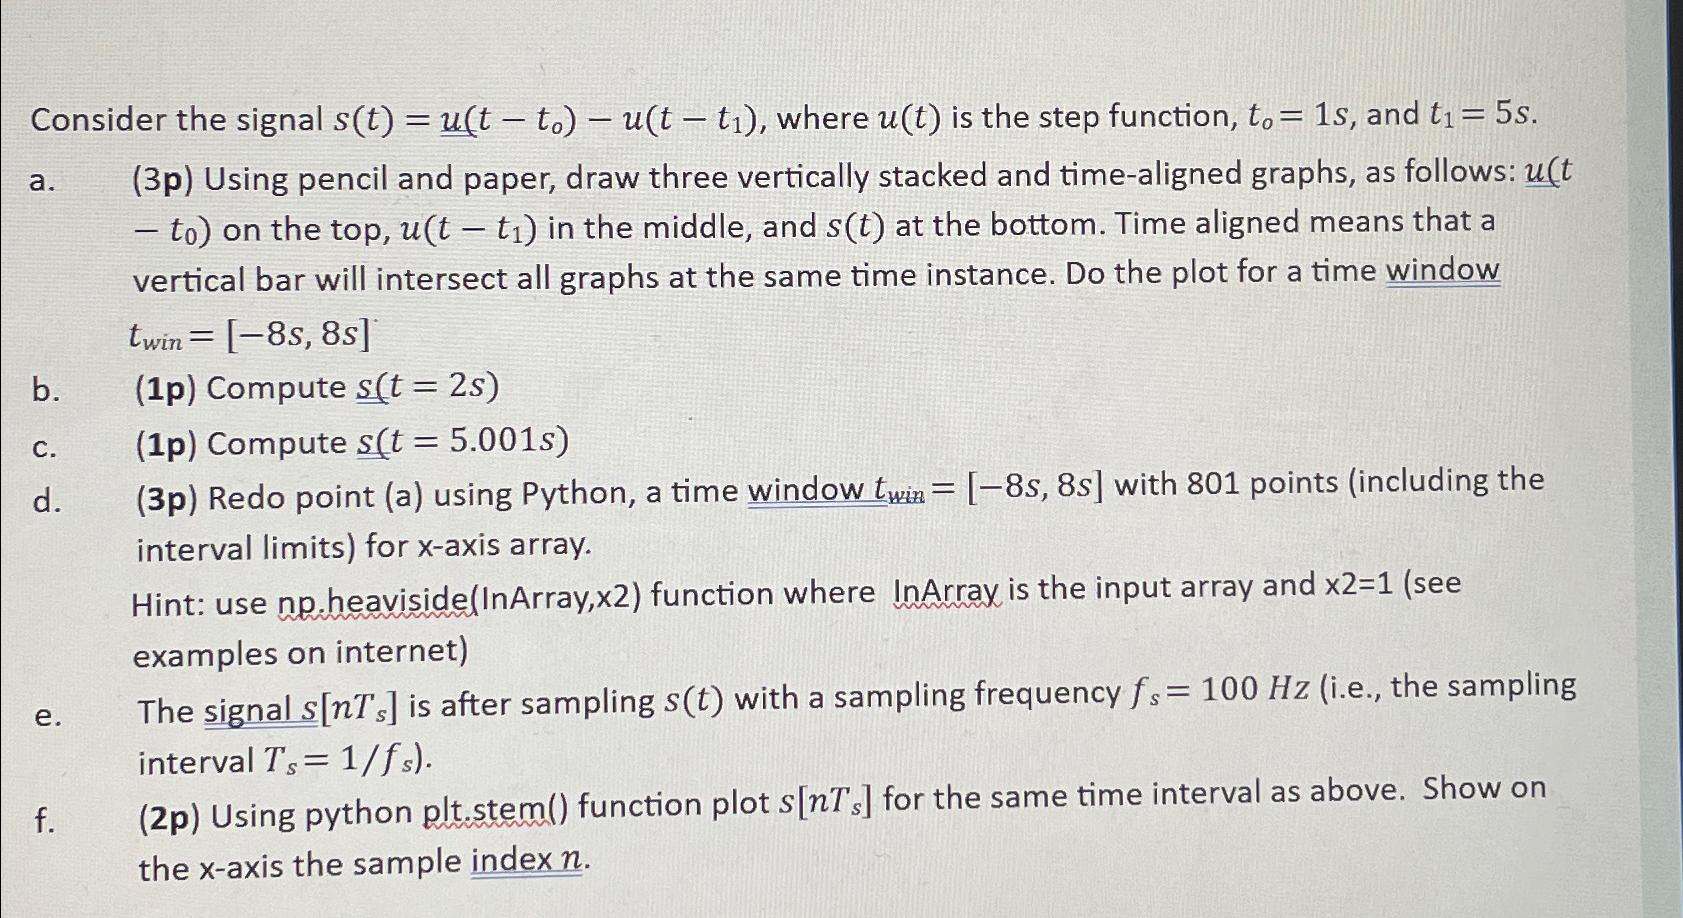
Consider the signal s(t)=u_(t-t_(0))-u(t-t_(1)) , where u(t) is the step function, t_(0)=1s , and t_(1)=5s . a. (3p) Using pencil and paper, draw three vertically
Consider the signal
s(t)=u_(t-t_(0))-u(t-t_(1)), where
u(t)is the step function,
t_(0)=1s, and
t_(1)=5s.\ a. (3p) Using pencil and paper, draw three vertically stacked and time-aligned graphs, as follows:
{(
:-t_(0))} on the top,
u(t-t_(1))in the middle, and
s(t)at the bottom. Time aligned means that a vertical bar will intersect all graphs at the same time instance. Do the plot for a time window
t_(win )=[-8s,8s]\ b. (1p) Compute
s_(t)=2s\ c. (1p) Compute
s(t)
=(
5.001s)\ d. (3p) Redo point (a) using Python, a time window
t_(win )=[-8s,8s]with 801 points (including the interval limits) for
x-axis array.\ Hint: use
np. heaviside(InArray,
x2) function where
lnArray is the input array and
x2=1(see examples on internet)\ e. The signal
s[nT_(s)]is after sampling
s(t)with a sampling frequency
f_(s)=100Hz(i.e., the sampling interval
T_(s)=(1)/(f_(s))).\ f. (2p) Using python plt.stem() function plot
s[nT_(s)]for the same time interval as above. Show on the
x-axis the sample index
n.

Step by Step Solution
There are 3 Steps involved in it
Step: 1

Get Instant Access to Expert-Tailored Solutions
See step-by-step solutions with expert insights and AI powered tools for academic success
Step: 2

Step: 3

Ace Your Homework with AI
Get the answers you need in no time with our AI-driven, step-by-step assistance
Get Started


