

Answered step by step
Verified Expert Solution
Question
1 Approved Answer
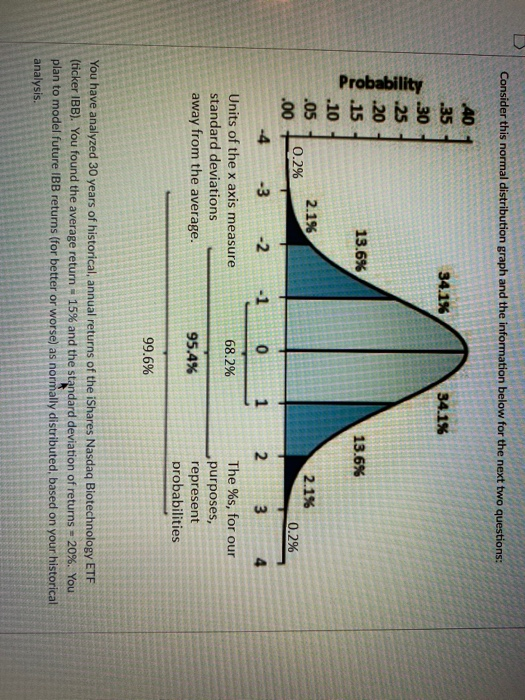
Consider this normal distribution graph and the information below for the next two questions: 34.1% Probability 40 .35 34.1% .30 25 .20 .15 13.6% .10
Step by Step Solution
There are 3 Steps involved in it
Step: 1

Get Instant Access to Expert-Tailored Solutions
See step-by-step solutions with expert insights and AI powered tools for academic success
Step: 2

Step: 3
Ace Your Homework with AI
Get the answers you need in no time with our AI-driven, step-by-step assistance
Get Started
Meetings Expositions Events And Conventions An Introduction To The Industry
Authors: George G. Fenich
4th Global Edition
1292093765, 9781292093765