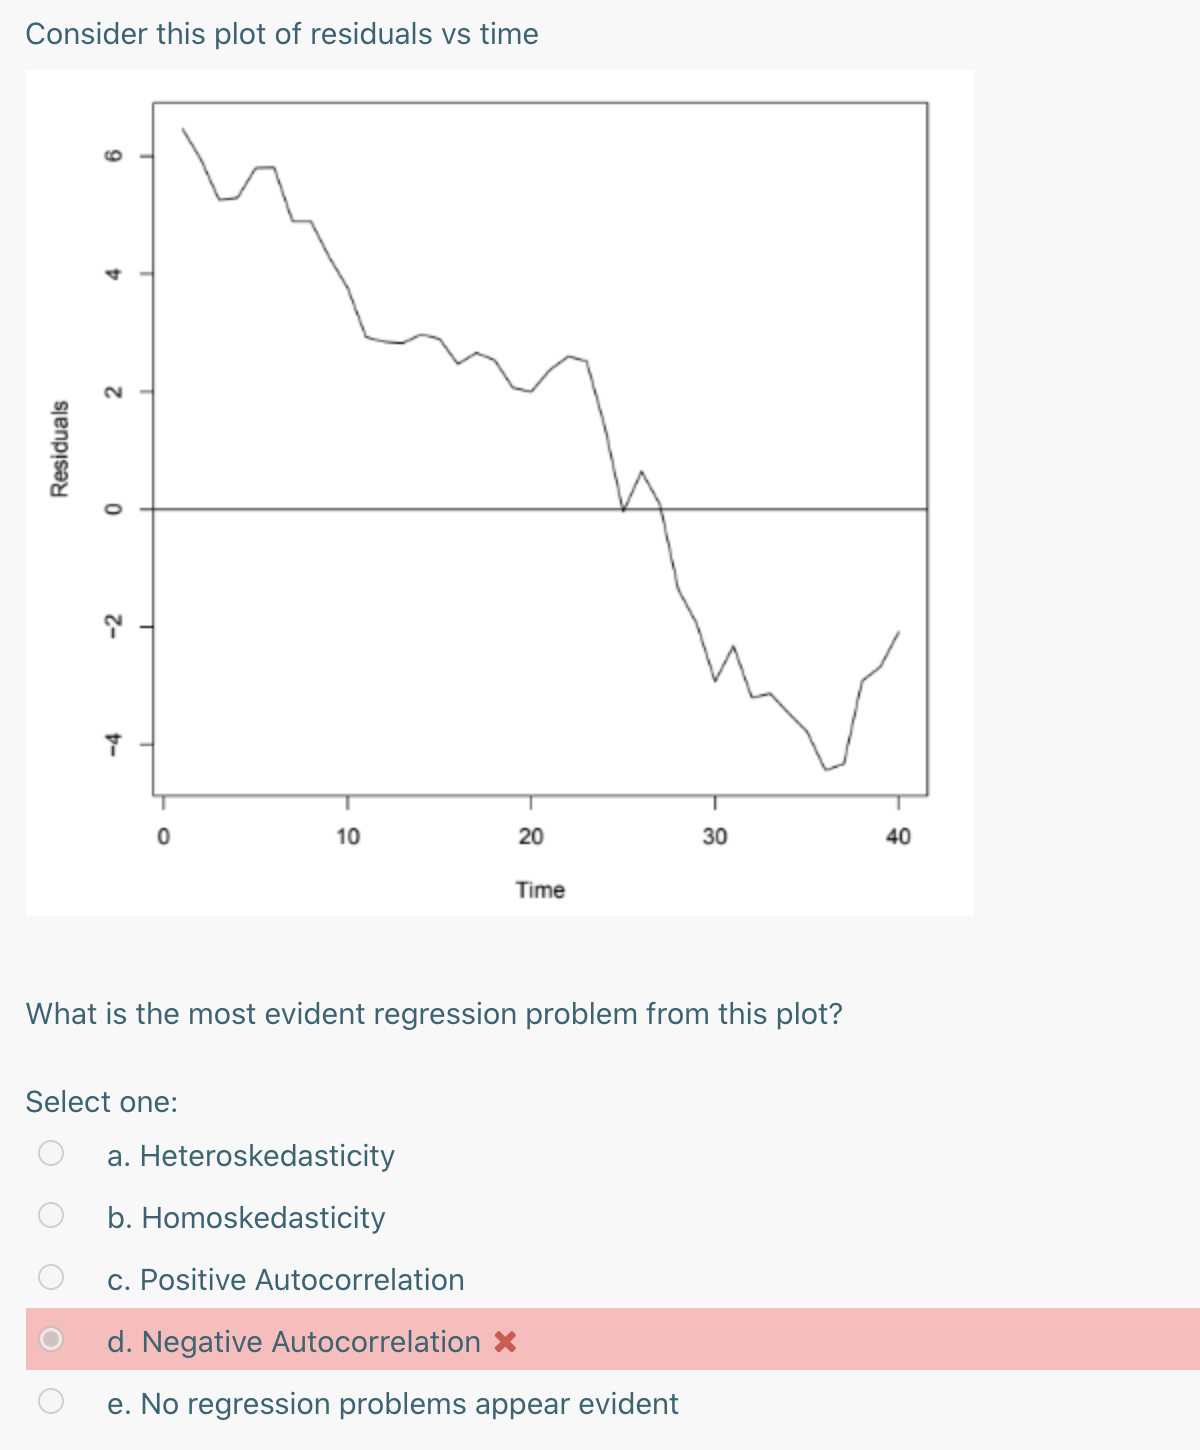
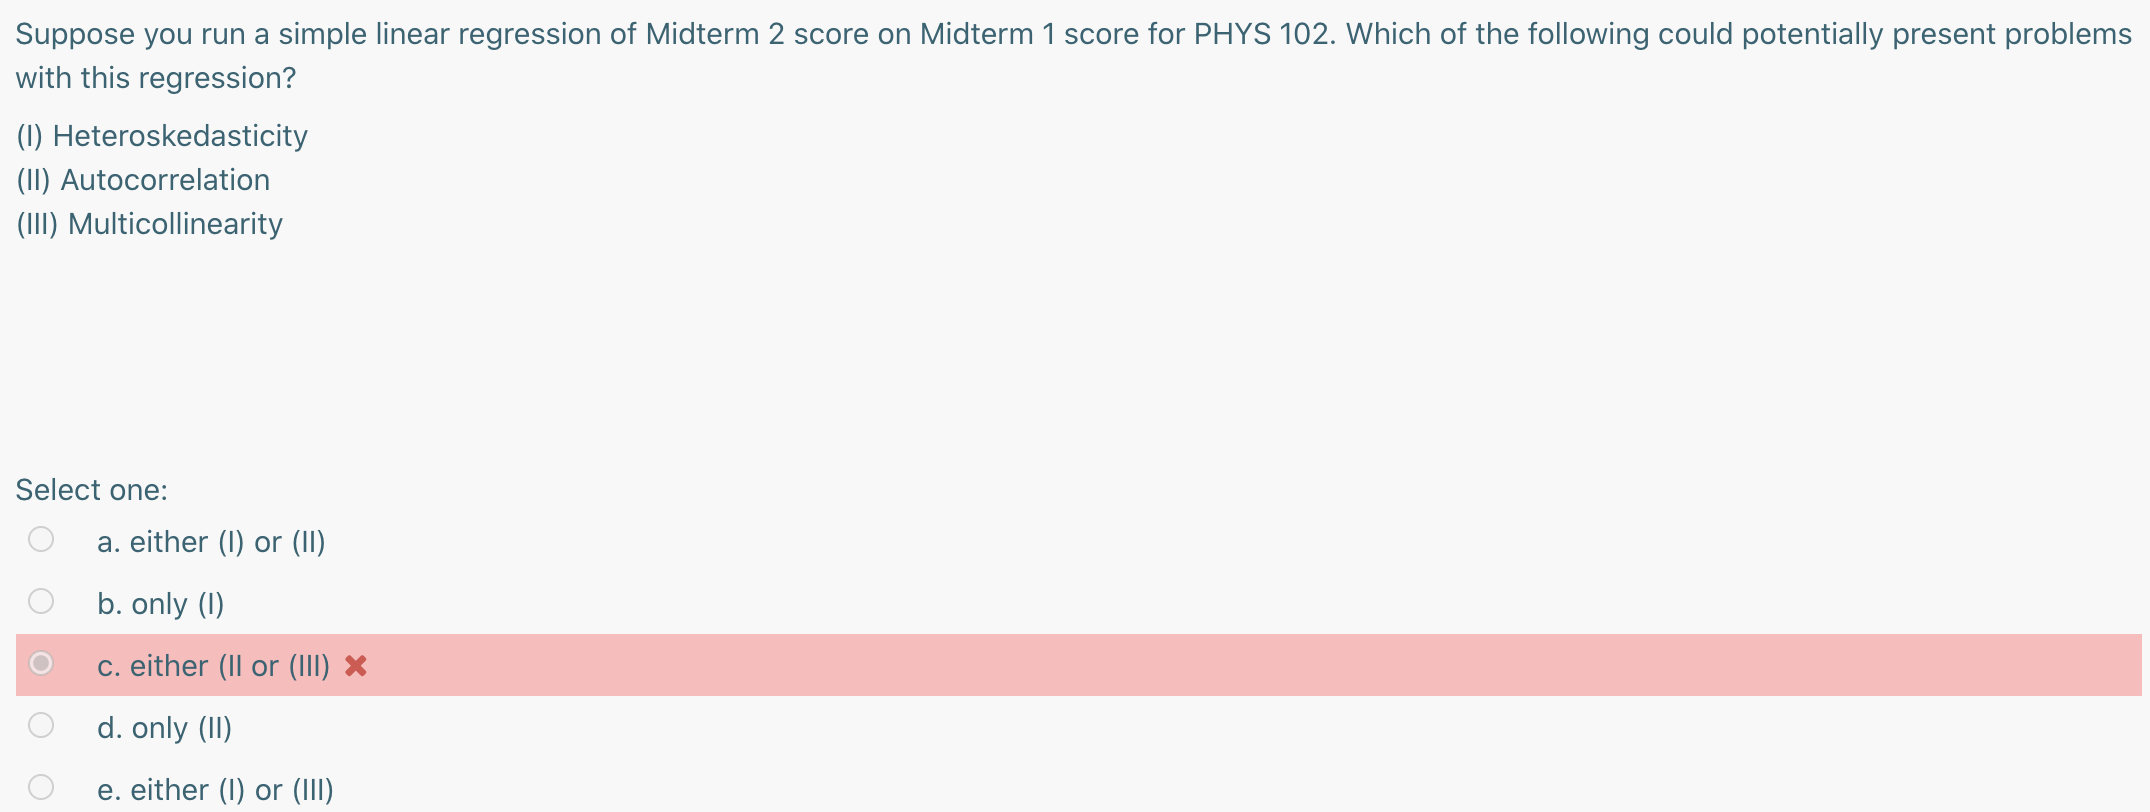
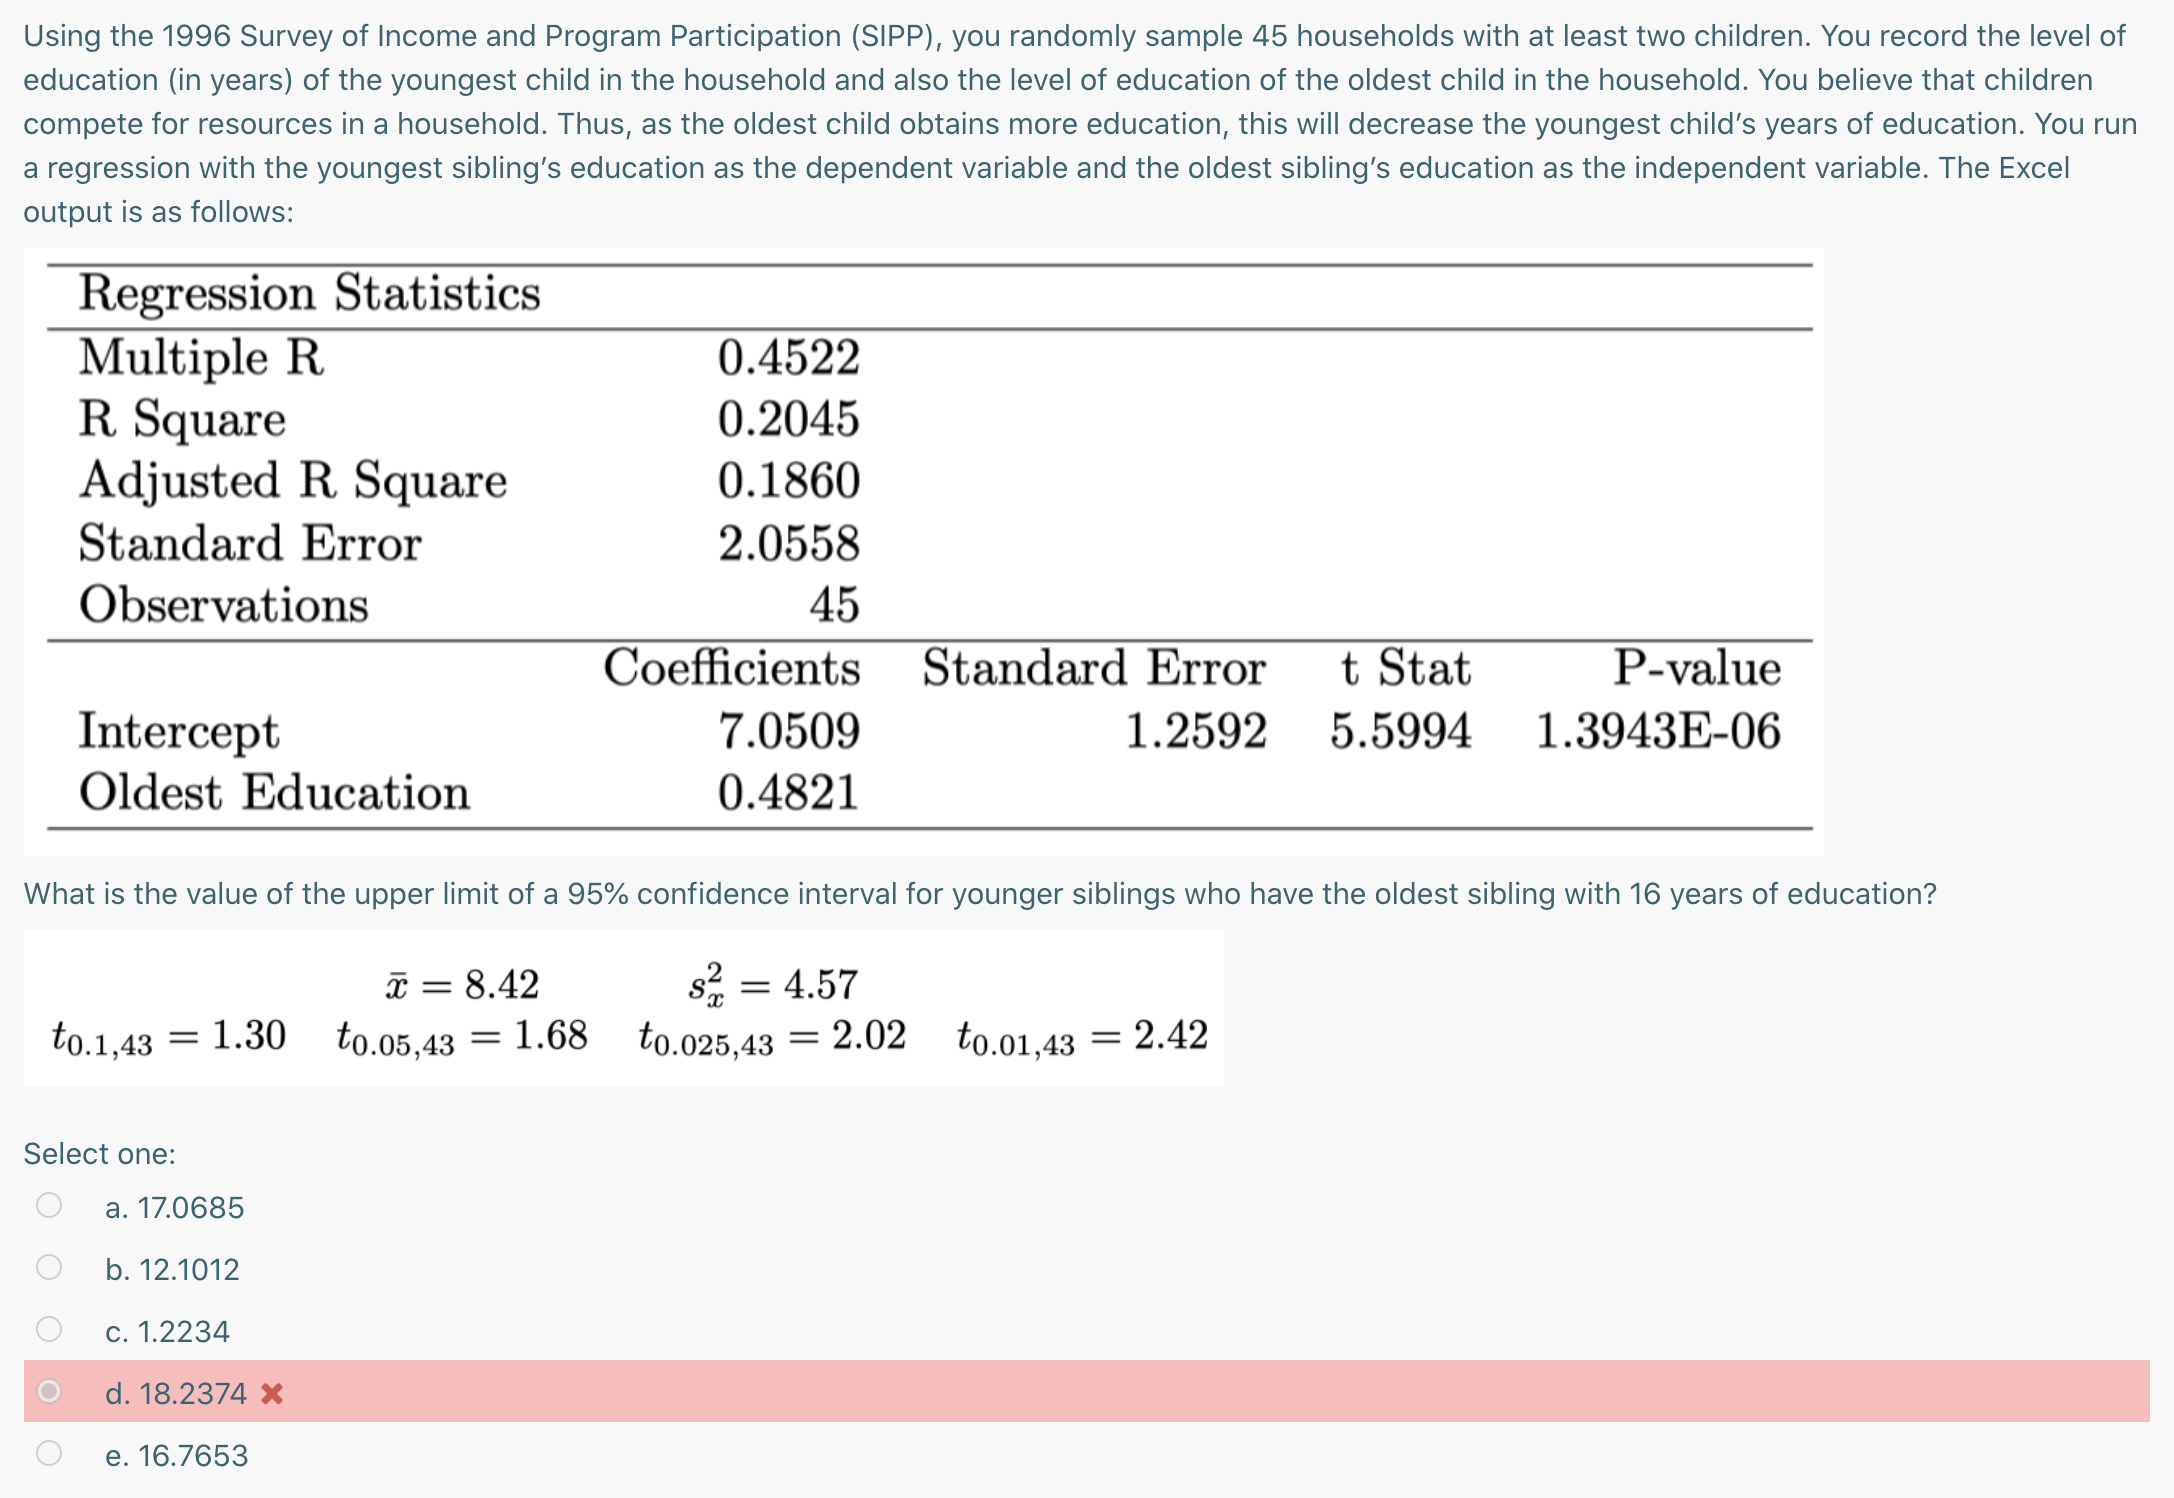
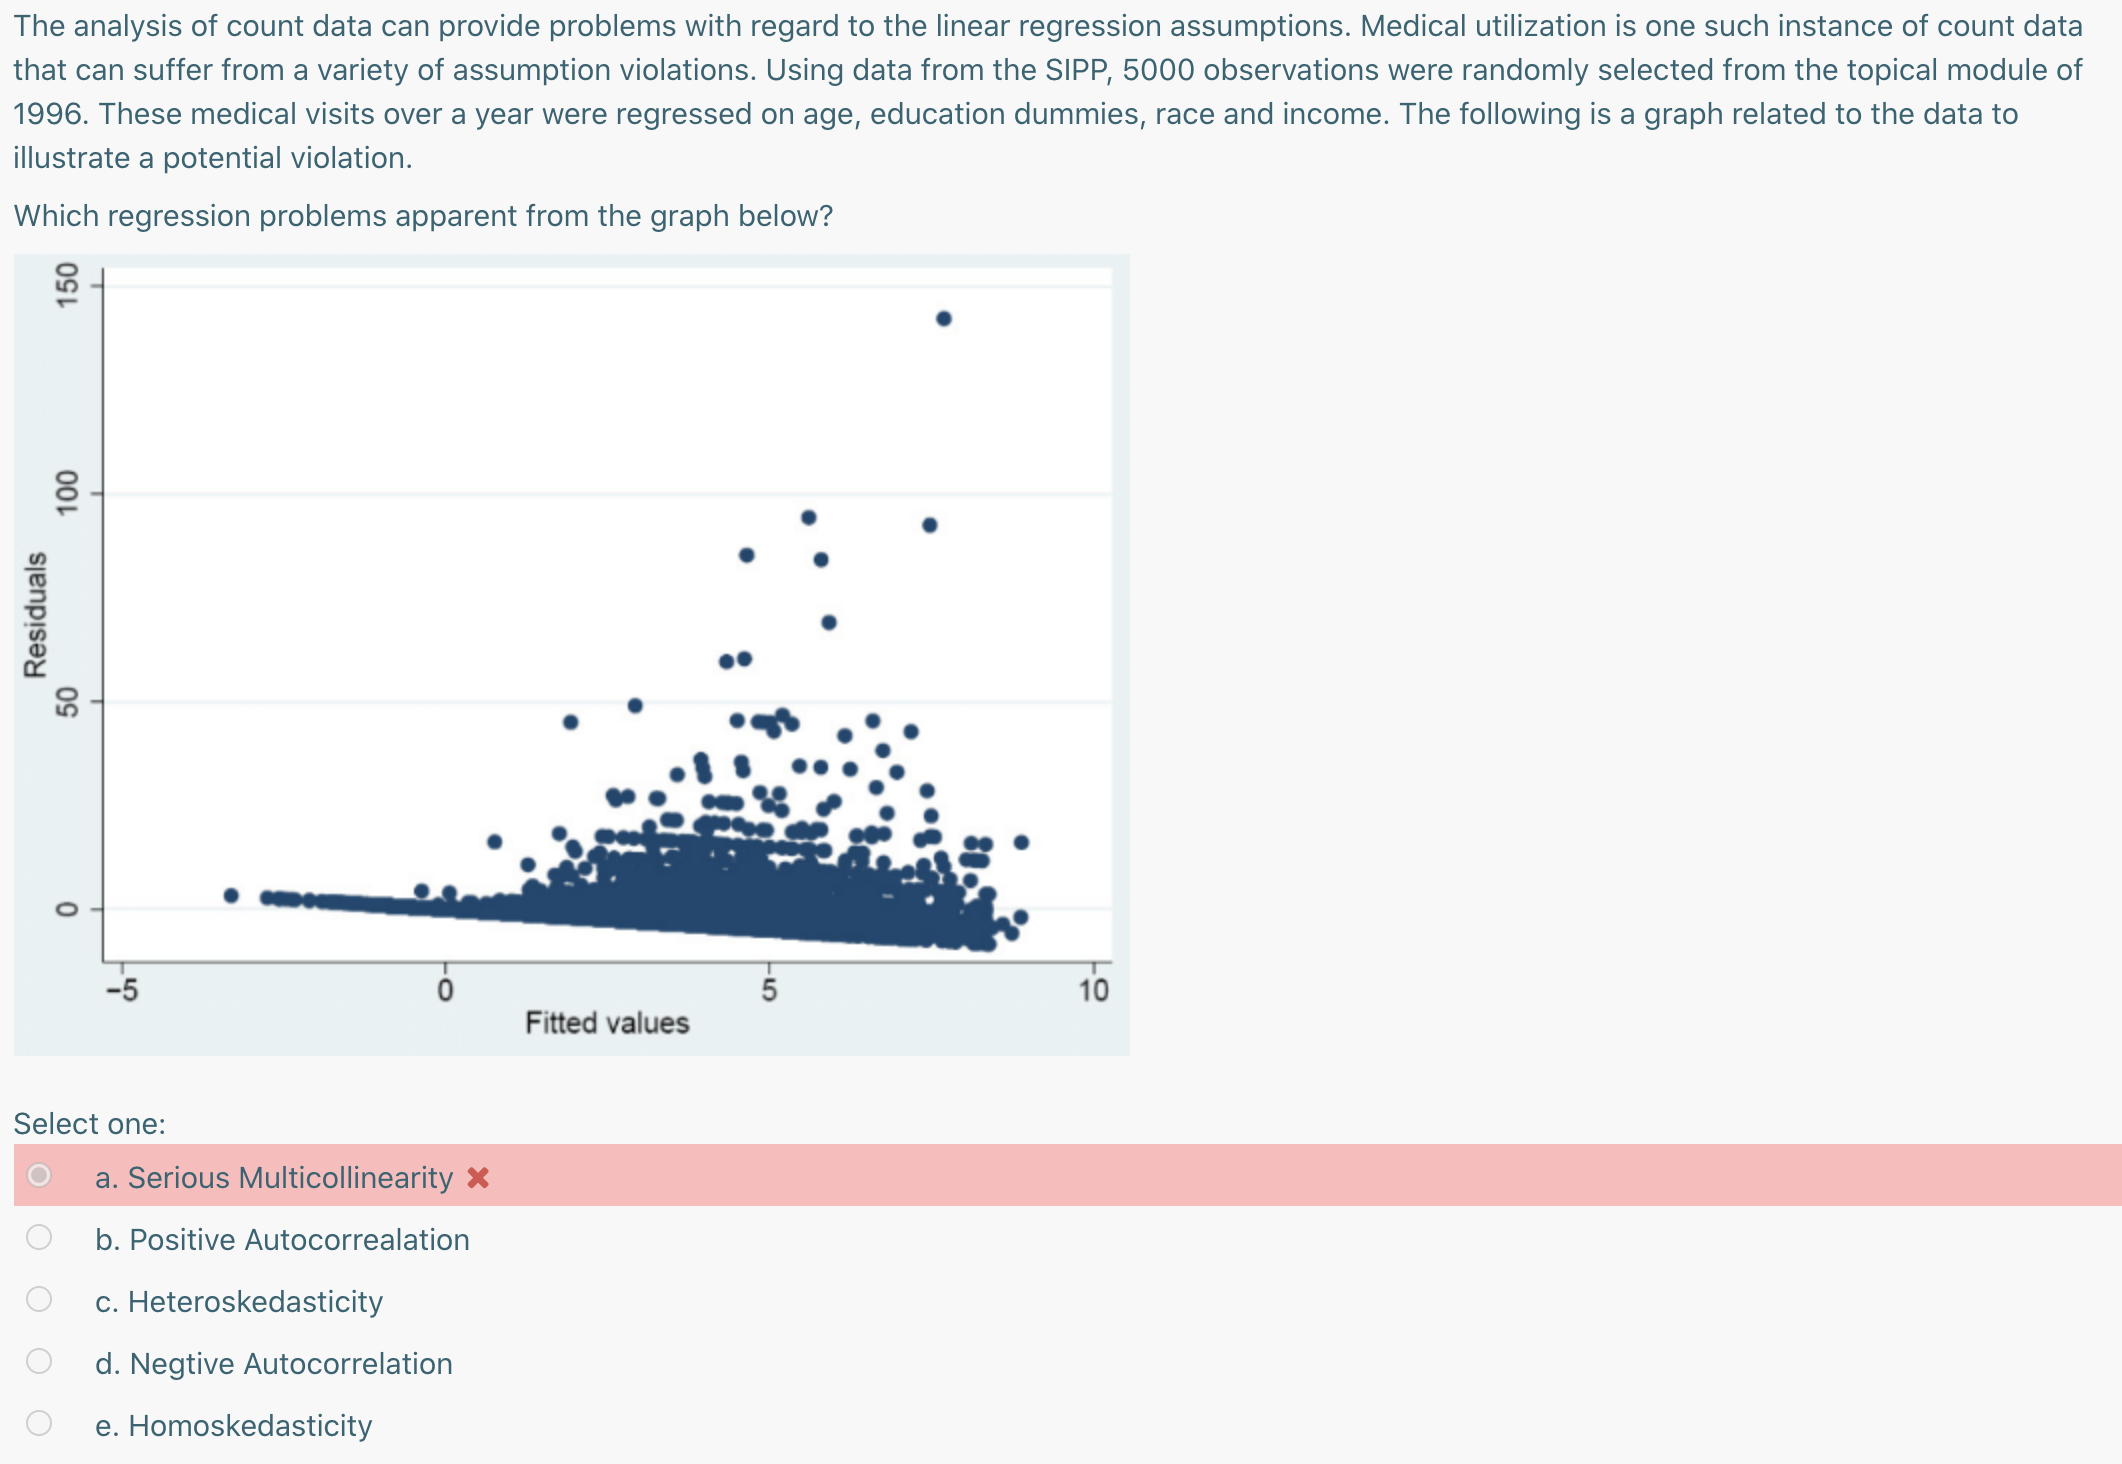
Consider this plot of residuals vs time Residuals O N 10 20 30 40 Time What is the most evident regression problem from this plot? Select one: O a. Heteroskedasticity O b. Homoskedasticity O c. Positive Autocorrelation O d. Negative Autocorrelation X O e. No regression problems appear evidentSuppose you run a simple linear regression of Midterm 2 score on Midterm 1 score for PHYS 102. Which of the following could potentially present problems with this regression? (I) Heteroskedasticity (ll) Autocorrelation (Ill) Multicollinearity Select one: Q a. either (I) or (ll) 0 b.only(l) Q d. only(ll) 0 e. either (I) or (III) Using the 1996 Survey of Income and Program Participation (SIPP), you randomly sample 45 households with at least two children. You record the level of education (in years) of the youngest child in the household and also the level of education of the oldest child in the household. You believe that children compete for resources in a household. Thus, as the oldest child obtains more education, this will decrease the youngest child's years of education. You run a regression with the youngest sibling's education as the dependent variable and the oldest sibling's education as the independent variable. The Excel output is as follows: Regression Statistics Multiple R 0.4522 R Square 0.2045 Adjusted R Square 0.1860 Standard Error 2.0558 Observations 45 Coefcients Standard Error t Stat P-value Intercept 7.0509 1.2592 5.5994 1.3943E06 Oldest Education 0.4821 What is the value of the upper limit of a 95% confidence interval for younger siblings who have the oldest sibling with 16 years of education? 55 = 8.42 s: = 4.57 to.1,43 = 1-30 to.05,43 = 1-68 to.o25,43 = 2-02 to.o1,43 = 2-42 Select one: Q a. 17.0685 0 b. 12.1012 0 c. 1.2234 0 e. 16.7653 The analysis of count data can provide problems with regard to the linear regression assumptions. Medical utilization is one such instance of count data that can suffer from a variety of assumption violations. Using data from the SIPP, 5000 observations were randomly selected from the topical module of 1996. These medical visits over a year were regressed on age, education dummies, race and income. The following is a graph related to the data to illustrate a potential violation. Which regression problems apparent from the graph below? 8 1M Select one: b. Positive Autocorrealation c. Heteroskedasticity d. Negtive Autocorrelation 0000 e. Homoskedasticity