Question
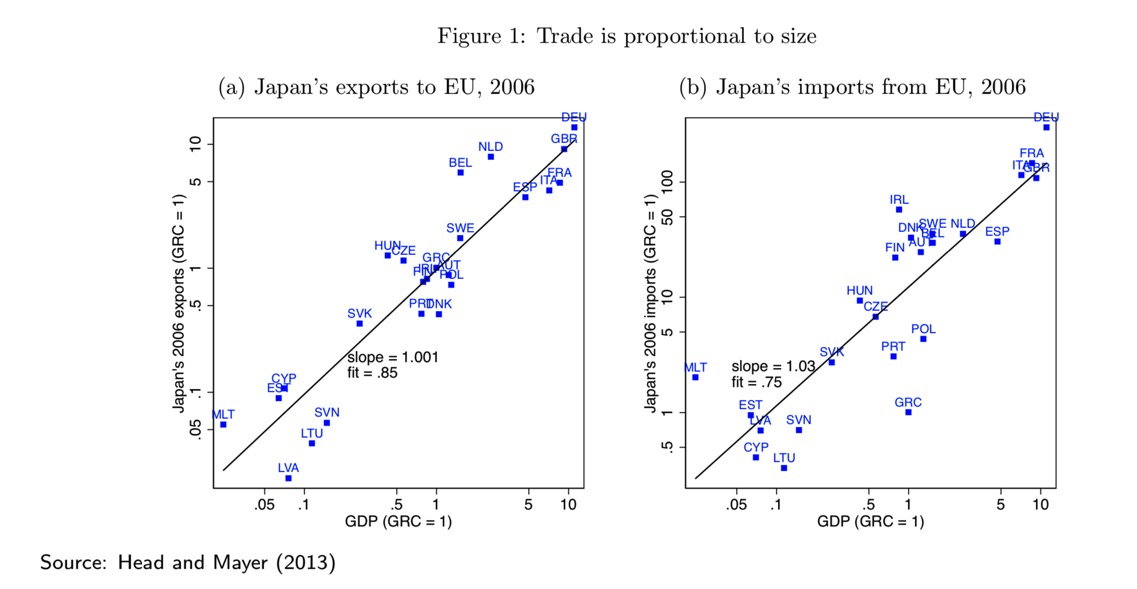
consider trade between the US and some European countries and you will make a figure similar to the one presented on slide 38 of Lecture
consider trade between the US and some European countries and you will make a figure similar to the one presented on slide 38 of Lecture 6 (the picture below). Go to the website with trade statistics from Eurostat athttps://appsso.eurostat.ec.europa.euui/submitViewTableAction.do(series code DS-016890).Down- load the data on imports to the US and exports from the US to 27 EU countries in 2019. In order to get this data you will need to customize the selection. Choose IMPORT and EXPORT as FLOW, VALUE_IN_EUROS as INDICATORS, US (United States) as PARTNER, 201952 (Jan.- Dec. 2019) as PERIOD, TOTAL (Total) as PRODUCT.
Next download the data on GDP in 2019 for the same 27 EU countries from Eurostat. Specically, go tohttps://appsso.eurostat.ec.europa.euui/submitViewTableAction.doand find the seriesGDP and main components (output, expenditure and income) -(series code nama_10_gdp). Using theDataexplorerselect the 27 individual EU counties as GEO, B1GQ (Gross domestic prod- uct at market prices) as NA_ITEM, 2019 as TIME, and CP_MEUR (Current prices, million euro) as UNIT. Convert the trade flows to millions of euros to make them denominated in the same units as GDP. Then plot the natural logarithm of exports from the US against the natural logarithm of GDP of the importing country. Plotting logarithms rather than levels makes figures easier to read when plotted quantities cover a wide range of numbers. In a separate figure, plot the natural logarithm of imports to the US against the natural logarithm of GDP of the exporting country.
How to use those figures to judge whether the gravity equation accounts well for bilateral trade between the US and European countries?

Step by Step Solution
There are 3 Steps involved in it
Step: 1

Get Instant Access to Expert-Tailored Solutions
See step-by-step solutions with expert insights and AI powered tools for academic success
Step: 2

Step: 3

Ace Your Homework with AI
Get the answers you need in no time with our AI-driven, step-by-step assistance
Get Started


