Answered step by step
Verified Expert Solution
Link Copied!

Question

1 Approved Answer

Considering the Figure 5-12, from 2017 to 2019, the money growth has increased from round 8% to around 11% while the interest rate was almost

Considering the Figure 5-12, from 2017 to 2019, the money growth has increased from round 8% to around 11% while the interest rate was almost constant. Why do you think the "liquidity effect" does not hold for the above period? How does Milton Friedman criticize the "liquidity effect"?
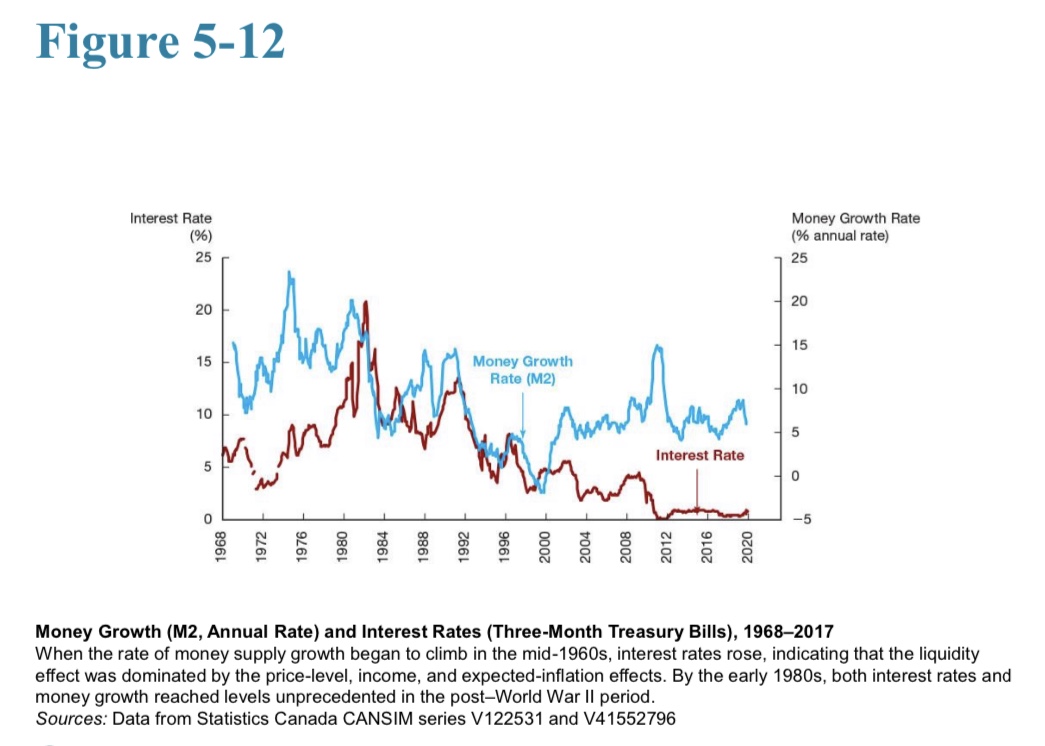
image text in transcribed
Figure 5-12 Interest Rate Money Growth Rate (6) (% annual rate) 25 25 20 20 15 Money Growth Rate (M2) 10 10 5 5 Interest Rate 0 O 1968 -5 1972 1976 1980 1984 1988 1992 1996 2000 2004 2008 2012 2016 2020 Money Growth (M2, Annual Rate) and Interest Rates (Three-Month Treasury Bills), 1968-2017 When the rate of money supply growth began to climb in the mid-1960s, interest rates rose, indicating that the liquidity effect was dominated by the price-level, income, and expected-inflation effects. By the early 1980s, both interest rates and money growth reached levels unprecedented in the post-World War II period. Sources: Data from Statistics Canada CANSIM series V122531 and V41552796

Step by Step Solution

There are 3 Steps involved in it

Step: 1

blur-text-image

Get Instant Access to Expert-Tailored Solutions

See step-by-step solutions with expert insights and AI powered tools for academic success

Step: 2

blur-text-image

Step: 3

blur-text-image

Ace Your Homework with AI

Get the answers you need in no time with our AI-driven, step-by-step assistance

Get Started

Recommended Textbook for

Price theory and applications

Authors: Steven E landsburg

8th edition

538746459, 1133008321, 780538746458, 9781133008323, 978-0538746458

More Books

Students also viewed these Economics questions