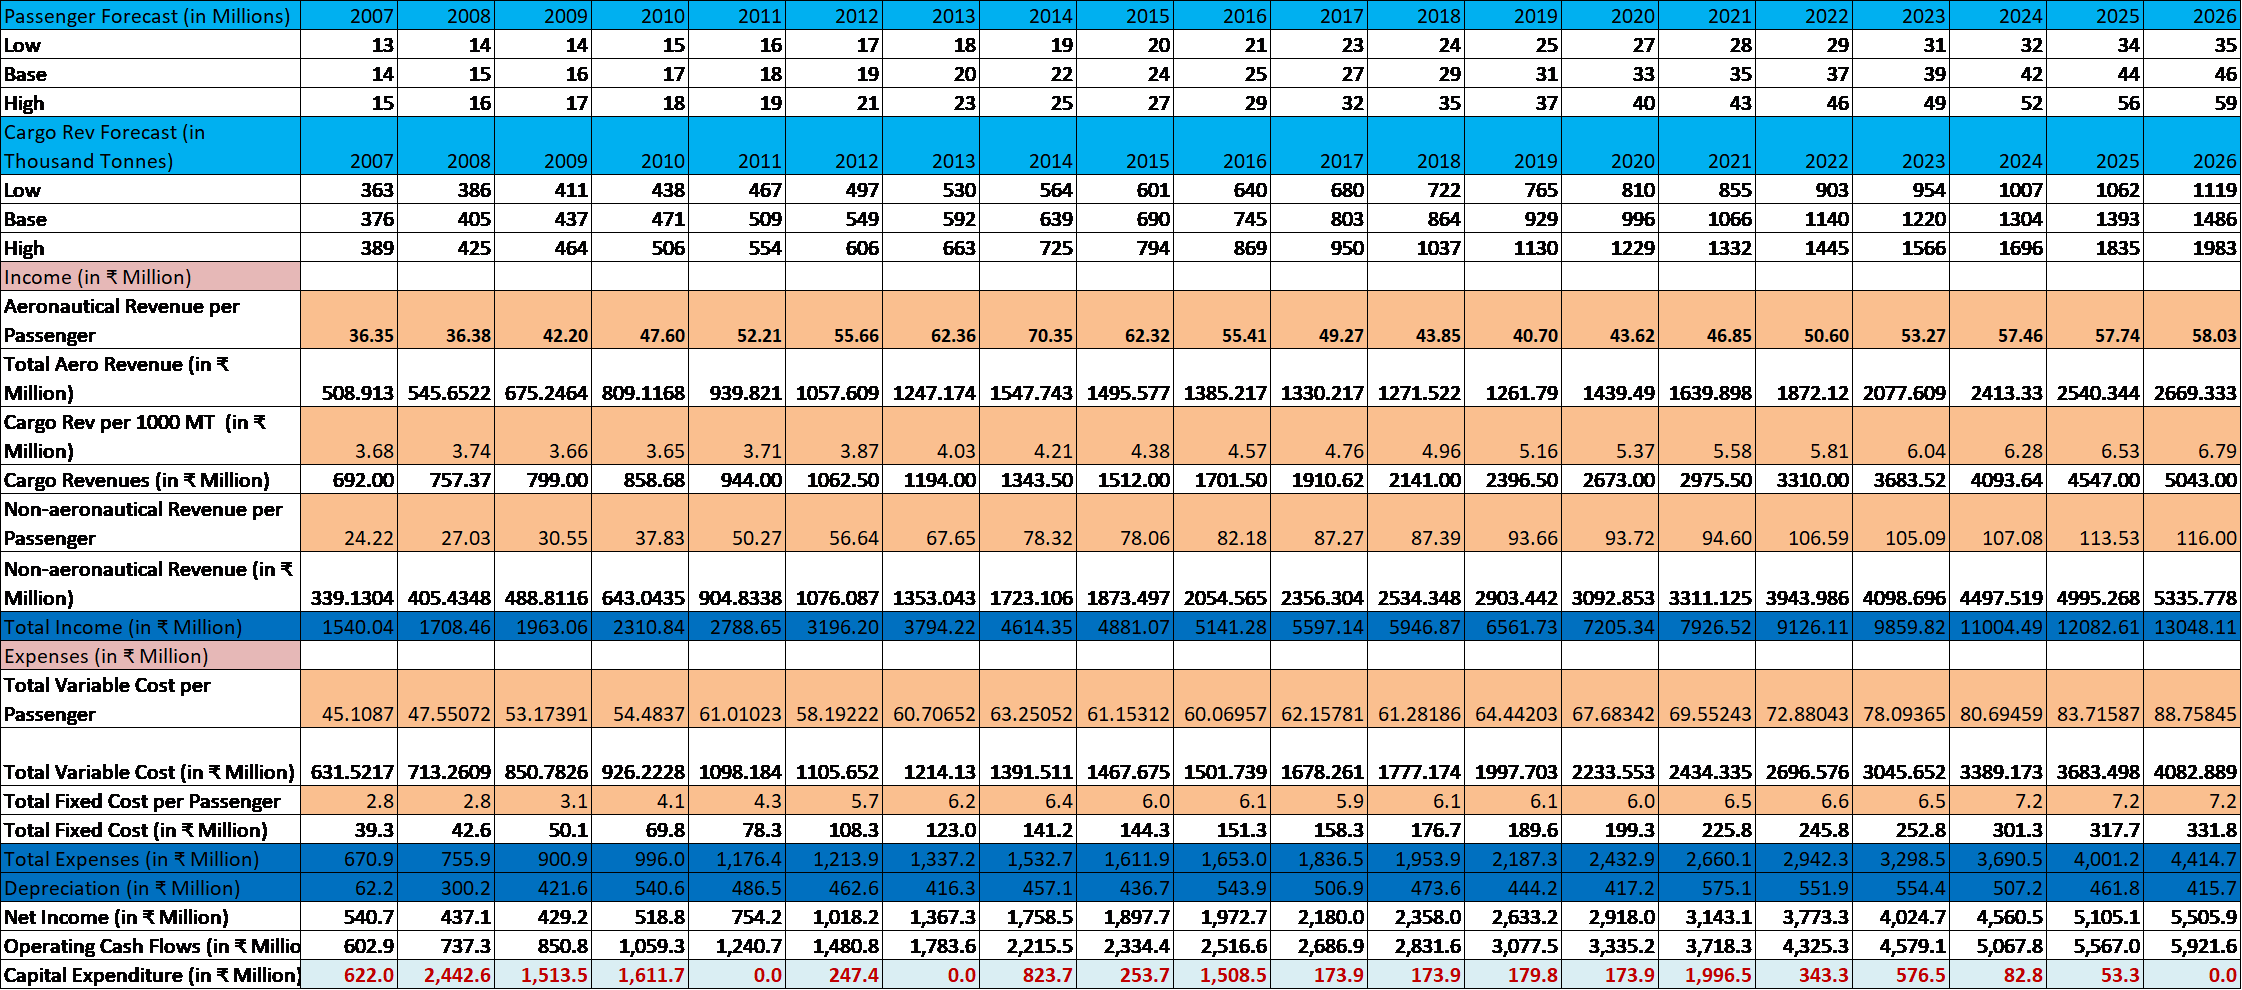
- Considering the primary lease period of 30 years . Use DCF techniques as NPV, IRR, MIRR for your analysis.
2008 2009 2011 2012 2013 2014 2017 2018 2021 2022 2023 2026 2007 13 2010 15 2015 20 2020 27 2025 34 14 14 16 18 19 23 24 28 29 35 17 19 2016 21 25 29 2019 25 31 37 31 39 2024 32 42 52 14 15 16 17 18 22 33 35 46 20 23 24 27 27 32 29 35 37 46 44 56. 15 16 17 18 19 21 25 40 43 49 59 2008 2026 2007 363 2009 411 437 2013 530 2014 564 2015 601 2016 640 2017 680 2018 722 2021 855 2022 903 2023 954 386 1119 2010 438 471 506 2011 467 509 554 2012 497 549 606 2019 765 929 1130 2020 810 996 1229 2024 1007 1304 1696 2025 1062 1393 1835 405 592 639 690 745 803 1066 1220 1486 376 389 864 1037 1140 1445 425 464 663 725 794 869 950 1332 1566 1983 36.35 36.38 42.20 47.60 52.21 55.66 62.36 70.35 62.32 55.41 49.27 43.85 40.70 43.62 46.85 50.60 53.27 57.46 57.74 58.03 Passenger Forecast (in Millions) Low Base High Cargo Rev Forecast (in Thousand Tonnes) Low Base High Income (in Million) Aeronautical Revenue per Passenger Total Aero Revenue (in Million) Cargo Rev per 1000 MT (in* Million) Cargo Revenues (in Million) Non-aeronautical Revenue per Passenger Non-aeronautical Revenue (in * Million) Total Income (in Million) Expenses (in Million) Total Variable Cost per Passenger 508.913 545.6522 675.2464 809.1168 939.821 1057.609 1247.174 1547.743 1495.577 1385.217 1330.217 1271.522 1261.79 1439.49 1639.898 1872.12 2077.609 2413.33 2540.344 2669.333 3.68 3.66 3.65 3.71 3.87 4.96 5.37 6.04 6.28 6.53 3.74 757.37 4.03 1194.00 4.21 1343.50 4.38 1512.00 4.57 1701.50 4.76 1910.62 5.16 2396.50 5.58 2975.50 5.81 3310.00 6.79 5043.00 692.00 799.00 858.68 944.00 1062.50 2141.00 2673.00 3683.52 4093.64 4547.00 24.22 27.03 30.55 37.83 50.27 56.64 67.65 78.32 78.06 82.18 87.27 87.39 93.66 93.72 94.60 106.59 105.09 107.08 113.53 116.00 339.1304 405.4348 488.8116 643.0435 904.8338 1076.087 1353.043 1723.106 1873.497 2054.565 2356.304 2534.348 2903.442 3092.853 3311.125 3943.986 4098.696 4497.519 4995.268 5335.778 1540.04 1708.46 1963.06 2310.84 2788.65 3196.20 3794.22 4614.35 4881.07 5141.28 5597.14 5946.87 6561.73 7205.34 7926.52 9126.11 9859.82 11004.49 12082.61 13048.11 45.1087 47.55072 53.17391 54.4837 61.01023 58.19222 60.70652 63.25052 61.15312 60.06957 62.15781 61.28186 64.44203 67.68342 69.55243 72.88043 78.09365 80.69459 83.71587 88.75845 Total Variable Cost (in Million) 631.5217 713.2609 850.7826 926.2228 1098.184 1105.652 Total Fixed Cost per Passenger 2.8 2.8 3.1 4.1 4.3 5.7 Total Fixed Cost (in Million) 39.3 42.6 50.1 69.8 78.3 108.3 Total Expenses (in Million) 670.9 755.9 900.9 996.0 1,176.4 1,213.9 Depreciation (in Million) 62.2 300.2 421.6 540.6 486.5 462.6 Net Income (in Million) 540.7 437.1 429.2 518.8 754.2 1,018.2 Operating Cash Flows (in Millio 602.9 737.3 850.8 1,059.3 1,240.7 1,480.8 Capital Expenditure (in Million 622.0 2,442.6 1,513.5 1,611.7 247.4 1214.13 1391.511 1467.675 1501.739 1678.261 1777.174 1997.703 2233.553 2434.335 2696.576 3045.652 3389.173 3683.498 4082.889 6.2 6.4 6.0 6.1 5.9 6.1 6.1 6.0 6.5 6.6 6.5 7.2 7.2 7.2 123.0 141.2 144.3 151.3 158.3 176.7 189.6 199.3 225.8 245.8 252.8 301.3 317.7 331.8 1,337.2 1,532.7 1,611.9 1,653.0 1,836.5 1,953.9 2,187.3 2,432.9 2,660.1 2,942.3 3,298.5 3,690.5 4,001.2 4,414.7 416.3 457.1 436.7 543.9 506.9 473.6 444.2 417.2 575.1 551.9 554.4 507.2 461.8 415.7 1,367.3 1,758.5 1,897.7 1,972.7 2,180.0 2,358.0 2,633.2 2,918.0 3,143.1 3,773.3 4,024.7 4,560.5 5,105.1 5,505.9 1,783.6 2,215.5 2,334.4 2,516.6 2,686.9 2,831.6 3,077.5 3,335.2 3,718.3 4,325.3 4,579.1 5,067.8 5,567.0 5,921.6 0.0 823.7 253.7 1,508.5 173.9 173.9 179.8 173.9 1,996.5 343.3 576.5 82.8 53.3 0.0 0.0 2008 2009 2011 2012 2013 2014 2017 2018 2021 2022 2023 2026 2007 13 2010 15 2015 20 2020 27 2025 34 14 14 16 18 19 23 24 28 29 35 17 19 2016 21 25 29 2019 25 31 37 31 39 2024 32 42 52 14 15 16 17 18 22 33 35 46 20 23 24 27 27 32 29 35 37 46 44 56. 15 16 17 18 19 21 25 40 43 49 59 2008 2026 2007 363 2009 411 437 2013 530 2014 564 2015 601 2016 640 2017 680 2018 722 2021 855 2022 903 2023 954 386 1119 2010 438 471 506 2011 467 509 554 2012 497 549 606 2019 765 929 1130 2020 810 996 1229 2024 1007 1304 1696 2025 1062 1393 1835 405 592 639 690 745 803 1066 1220 1486 376 389 864 1037 1140 1445 425 464 663 725 794 869 950 1332 1566 1983 36.35 36.38 42.20 47.60 52.21 55.66 62.36 70.35 62.32 55.41 49.27 43.85 40.70 43.62 46.85 50.60 53.27 57.46 57.74 58.03 Passenger Forecast (in Millions) Low Base High Cargo Rev Forecast (in Thousand Tonnes) Low Base High Income (in Million) Aeronautical Revenue per Passenger Total Aero Revenue (in Million) Cargo Rev per 1000 MT (in* Million) Cargo Revenues (in Million) Non-aeronautical Revenue per Passenger Non-aeronautical Revenue (in * Million) Total Income (in Million) Expenses (in Million) Total Variable Cost per Passenger 508.913 545.6522 675.2464 809.1168 939.821 1057.609 1247.174 1547.743 1495.577 1385.217 1330.217 1271.522 1261.79 1439.49 1639.898 1872.12 2077.609 2413.33 2540.344 2669.333 3.68 3.66 3.65 3.71 3.87 4.96 5.37 6.04 6.28 6.53 3.74 757.37 4.03 1194.00 4.21 1343.50 4.38 1512.00 4.57 1701.50 4.76 1910.62 5.16 2396.50 5.58 2975.50 5.81 3310.00 6.79 5043.00 692.00 799.00 858.68 944.00 1062.50 2141.00 2673.00 3683.52 4093.64 4547.00 24.22 27.03 30.55 37.83 50.27 56.64 67.65 78.32 78.06 82.18 87.27 87.39 93.66 93.72 94.60 106.59 105.09 107.08 113.53 116.00 339.1304 405.4348 488.8116 643.0435 904.8338 1076.087 1353.043 1723.106 1873.497 2054.565 2356.304 2534.348 2903.442 3092.853 3311.125 3943.986 4098.696 4497.519 4995.268 5335.778 1540.04 1708.46 1963.06 2310.84 2788.65 3196.20 3794.22 4614.35 4881.07 5141.28 5597.14 5946.87 6561.73 7205.34 7926.52 9126.11 9859.82 11004.49 12082.61 13048.11 45.1087 47.55072 53.17391 54.4837 61.01023 58.19222 60.70652 63.25052 61.15312 60.06957 62.15781 61.28186 64.44203 67.68342 69.55243 72.88043 78.09365 80.69459 83.71587 88.75845 Total Variable Cost (in Million) 631.5217 713.2609 850.7826 926.2228 1098.184 1105.652 Total Fixed Cost per Passenger 2.8 2.8 3.1 4.1 4.3 5.7 Total Fixed Cost (in Million) 39.3 42.6 50.1 69.8 78.3 108.3 Total Expenses (in Million) 670.9 755.9 900.9 996.0 1,176.4 1,213.9 Depreciation (in Million) 62.2 300.2 421.6 540.6 486.5 462.6 Net Income (in Million) 540.7 437.1 429.2 518.8 754.2 1,018.2 Operating Cash Flows (in Millio 602.9 737.3 850.8 1,059.3 1,240.7 1,480.8 Capital Expenditure (in Million 622.0 2,442.6 1,513.5 1,611.7 247.4 1214.13 1391.511 1467.675 1501.739 1678.261 1777.174 1997.703 2233.553 2434.335 2696.576 3045.652 3389.173 3683.498 4082.889 6.2 6.4 6.0 6.1 5.9 6.1 6.1 6.0 6.5 6.6 6.5 7.2 7.2 7.2 123.0 141.2 144.3 151.3 158.3 176.7 189.6 199.3 225.8 245.8 252.8 301.3 317.7 331.8 1,337.2 1,532.7 1,611.9 1,653.0 1,836.5 1,953.9 2,187.3 2,432.9 2,660.1 2,942.3 3,298.5 3,690.5 4,001.2 4,414.7 416.3 457.1 436.7 543.9 506.9 473.6 444.2 417.2 575.1 551.9 554.4 507.2 461.8 415.7 1,367.3 1,758.5 1,897.7 1,972.7 2,180.0 2,358.0 2,633.2 2,918.0 3,143.1 3,773.3 4,024.7 4,560.5 5,105.1 5,505.9 1,783.6 2,215.5 2,334.4 2,516.6 2,686.9 2,831.6 3,077.5 3,335.2 3,718.3 4,325.3 4,579.1 5,067.8 5,567.0 5,921.6 0.0 823.7 253.7 1,508.5 173.9 173.9 179.8 173.9 1,996.5 343.3 576.5 82.8 53.3 0.0 0.0