Answered step by step
Verified Expert Solution
Link Copied!

Question

1 Approved Answer

considering this sawtooth signal x (t) t I(t) = at, (a) Obtain the Fourier Series coefficients for this signal. (b) Let 7 = 0.02 sec,

considering this sawtooth signal
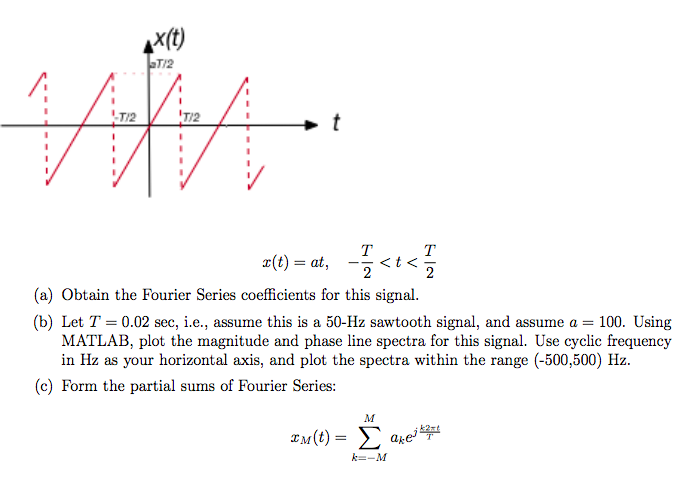
image text in transcribedimage text in transcribed
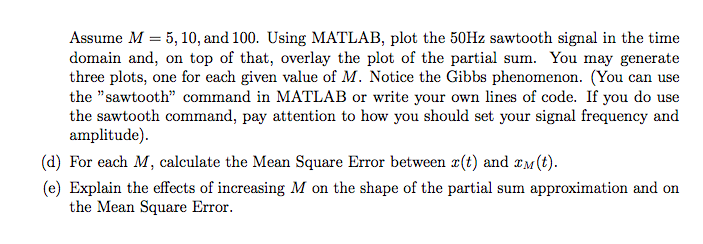
x (t) t I(t) = at, (a) Obtain the Fourier Series coefficients for this signal. (b) Let 7 = 0.02 sec, i.e., assume this is a 50-Hz sawtooth signal, and assume a = 100. Using MATLAB, plot the magnitude and phase line spectra for this signal. Use cyclic frequency in Hz as your horizontal axis, and plot the spectra within the range (-500,500) Hz. (c) Form the partial sums of Fourier Series: M IM(t ) = > akerties k=-MAssume M = 5, Ill, and llll]. Using MATLAE, plot the EHz sawtooth signal in the time domaln and, on top of that, overlayr the plot of the partial sum. You may generate three plots, one for each given value of M. Notice the Gibbs phenomenon. (You can use the \"sawtooth\" command in MATIAE or write your own lines of code. If you do use the sawtooth command, pa}r attention to hon.r you should set your signal frequency and amplitude). [d] For each M, calculate the Mean Square Error between unit) and aMj. (e) Explain the eEects of increasing M on the shape of the partial sum approximation and on the Mean Square Error

Step by Step Solution

There are 3 Steps involved in it

Step: 1

blur-text-image

Get Instant Access to Expert-Tailored Solutions

See step-by-step solutions with expert insights and AI powered tools for academic success

Step: 2

blur-text-image

Step: 3

blur-text-image

Ace Your Homework with AI

Get the answers you need in no time with our AI-driven, step-by-step assistance

Get Started

Recommended Textbook for

Complex Variables and Applications

Authors: James Brown, Ruel Churchill

8th edition

73051942, 978-0073051949

More Books

Students also viewed these Mathematics questions