

Answered step by step
Verified Expert Solution
Question
1 Approved Answer
CONSOLIDATED STATEMENT OF CASH FLOWSfor the year ended 3 1 st December 2 0 2 2 The financial statements are prepared and presented in ????
CONSOLIDATED STATEMENT OF CASH FLOWSfor the year ended st December The financial statements are prepared and presented in $ the functional cuThe notes on pages to and the principal accounting policies on pages to form part of these financial
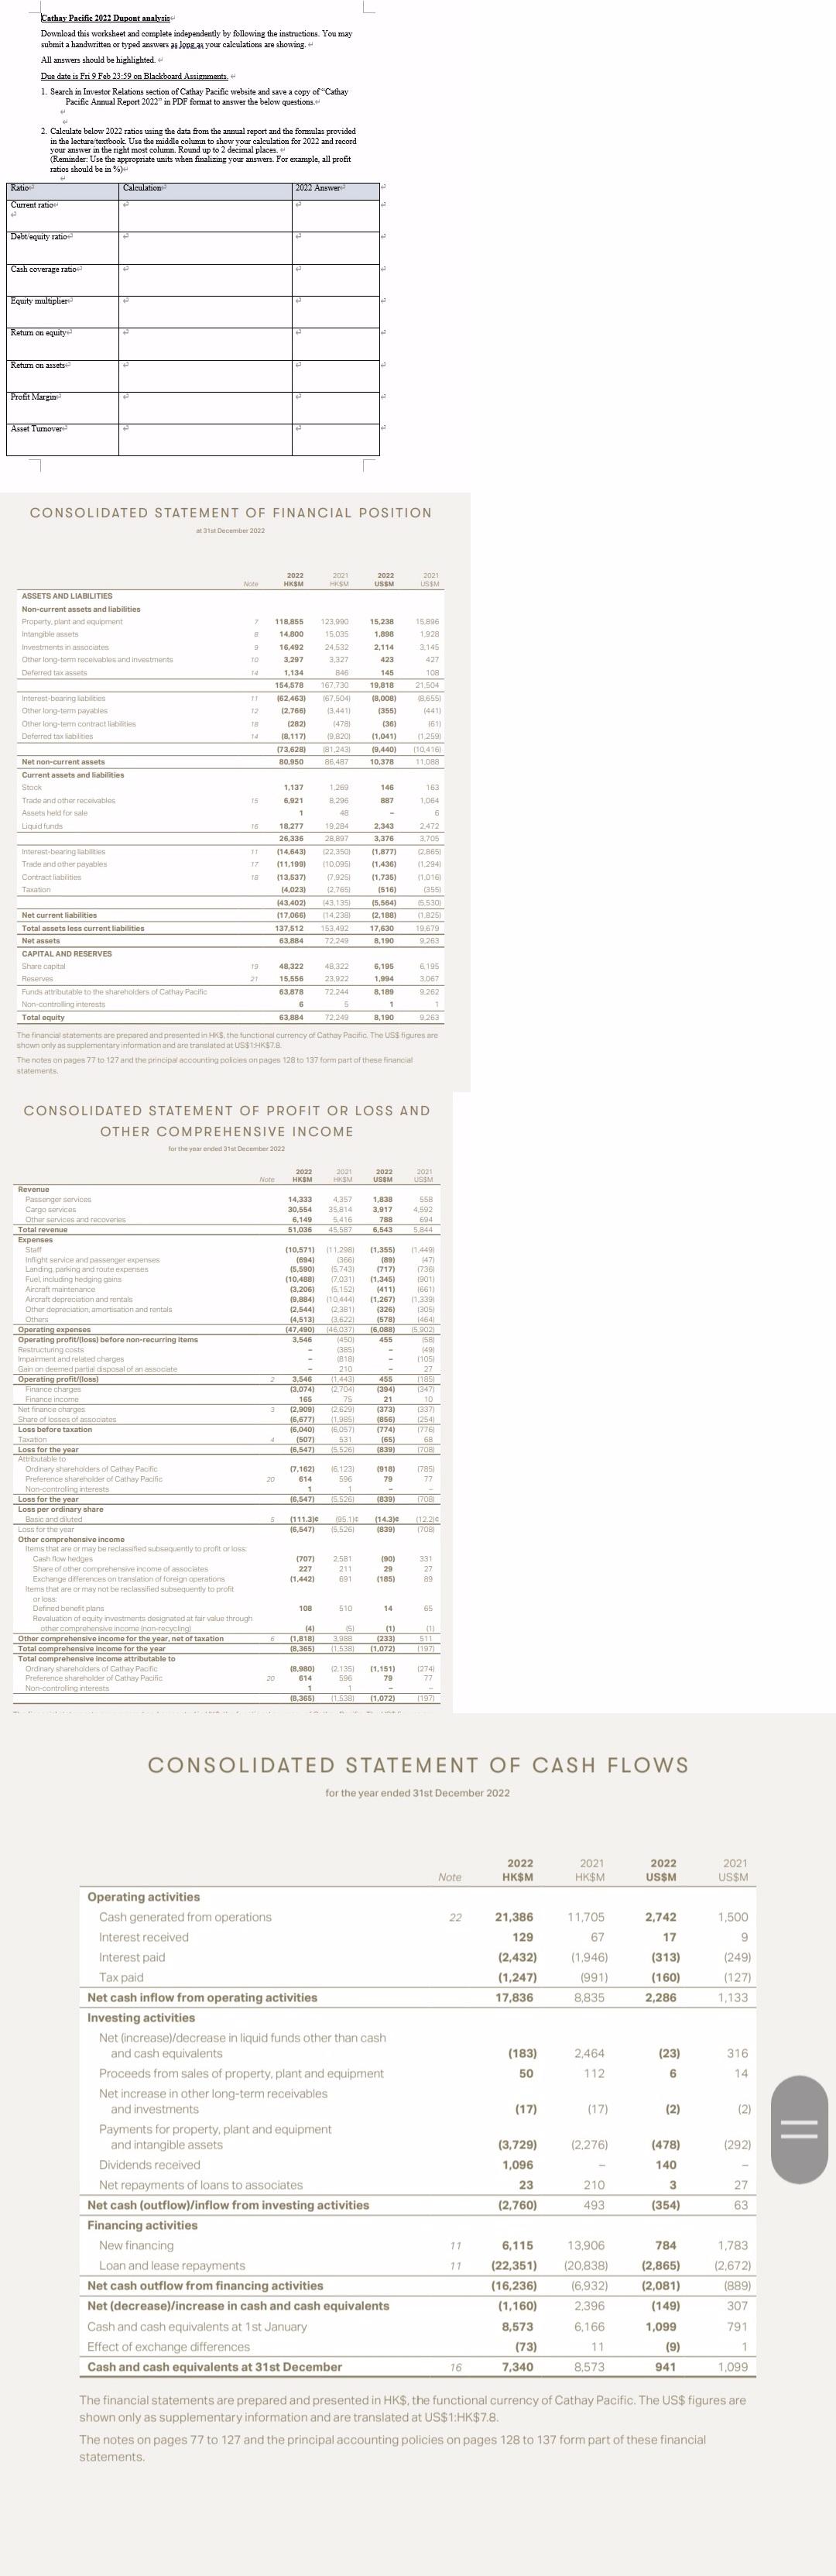
Ratio Cathay Pacific 2022 Dupont analysis Download this worksheet and complete independently by following the instructions. You may submit a handwritten or typed answers as long as your calculations are showing. + All answers should be highlighted. Due date is Fri 9 Feb 23:59 on Blackboard Assignments.+ 1. Search in Investor Relations section of Cathay Pacific website and save a copy of "Cathay Pacific Annual Report 2022" in PDF format o answer the below questions.+ 2. Calculate below 2022 ratios using the data from the annual report and the formulas provided in the lecture textbook. Use the middle column to show your calculation for 2022 and record your answer in the right most column. Round up to 2 decimal places.+ (Reminder: Use the appropriate units when finalizing your answers. For example, all profit ratios should be in %) Current ratio + Debt/equity ratio Cash coverage ratio Equity multiplier Return on equity Return on assets Profit Margin Asset Tumover Calculation 2022 Answer CONSOLIDATED STATEMENT OF FINANCIAL POSITION at 31st December 2022 ASSETS AND LIABILITIES Note 2022 HKSM 2021 HKSM 2022 USSM 2021 US$M Non-current assets and liabilities Property, plant and equipment 7 Intangible assets B 118,855 14,800 123.990 15.035 15,238 1,898 15.896 1928 Investments in associates 9 16,492 24,532 2,114 3,145 Other long-term receivables and investments TO 3,297 3,327 423 427 Deferred tax assets 14 1.134 846 145 108 154,578 167,730 19,818 21.504 Interest-bearing liabilities 11 (62,463) (67,504) (8,008) (8,655) Other long-term payables 12 (2,766) (3.441) (355) (441) Other long-term contract liabilities 18 (282) Deferred tax liabilities (8,117) (73,628) 80,950 (478) (9,820) (36) (61) (1,041) 181.2431 (9,440) 86.487 10.378 (1.259) [10416) 11,088 Net non-current assets Current assets and liabilities Stock Trade and other receivables Assets held for sale Liquid funds Interest-bearing liabilities Trade and other payables Contract liabilities Taxation Net current liabilities Total assets less current liabilities Net assets. CAPITAL AND RESERVES Share capital Reserves Funds attributable to the shareholders of Cathay Pacific Non-controlling interests Total equity 1,137 15 6.921 1 1,269 8,296 48 146 887 163 1.064 6 16 18,277 19,284 17 26,336 28,897 (14,643) (22,350) (11,199) 2,343 3,376 2.472 3,705 (1,877) (2,865) (10,095) (1,436) (1,294) 18 (13,537) (7,925) (1,735) (1.016) (4,023) (2,765) (516) (355) (43,402) (43,135) (5,564) (5,530) (17,066) [14,238) (2,188) (1.825) 137,512 153,492 17,630 19,679 63,884 72.249 8,190 9.263 48.322 48.322 6,195 6,195 15,556 23,922 1,994 3.067 63,878 72.244 8,189 9.262 6 5 1 63,884 72.249 8,190 9.263 The financial statements are prepared and presented in HKS, the functional currency of Cathay Pacific. The US$ figures are shown only as supplementary information and are translated at US$1:HK$7.8. The notes on pages 77 to 127 and the principal accounting policies on pages 128 to 137 form part of these financial statements. CONSOLIDATED STATEMENT OF PROFIT OR LOSS AND OTHER COMPREHENSIVE INCOME for the year ended 31st December 2022 Note 2022 HKSM HKSM 2022 USSM 2021 USSM Revenue Cargo services Passenger services Other services and recoveries Total revenue Expenses Staff 14,333 4,357 1,838 30,554 35.814 3,917 6,149 5416 51,036 45,587 788 6,543 558 4,592 694 5.844 (10,571) Inflight service and passenger expenses Landing, parking and route expenses Fuel, including hedging gains Aircraft maintenance Aircraft depreciation and rentals Other depreciation, amortisation and rentals Others Operating expenses Restructuring costs Impairment and related charges Gain on deemed partial disposal of an associate Operating profit/(loss) Finance charges (11.298) (694) (366) (5,590) (5,743) (10,488) (7,031) (3,206) (5.152) (1,355) (1.449) (89) (47) (717) (736) (1,345) (901) (411) (661) (9,884) (10444) (1,267) (1,339) (2,544) (2.381) (326) (305) (4,513) (3,622) (578) (464) (47.490) (46,037) (6,088) (5.902) Operating profit/(loss) before non-recurring items 3,546 (450) 455 (58) (385) - (49) - 3,546 (3,074) (818) 210 (1,443) (2.704) (105) 27 455 (185) (394) (347) Finance income Net finance charges Share of losses of associates Loss before taxation Taxation 165 (2,909) 75 21 10 (6,677) (2.629) (1.985) (373) (337) (856) (254) (6,040) (6,057) (774) (776) (507) 5311 (65) 68 Loss for the year Attributable to Ordinary shareholders of Cathay Pacific (6,547) (7,162) (6,123) (5.526) (839) (708) (918) (785) Preference shareholder of Cathay Pacific 20 614 596 79 77 Non-controlling interests Loss for the year (6,547) (5.526) (839) (708) Loss per ordinary share Basic and diluted Loss for the year (111.3)c (6,547) (95.114 (14.3)c (12.2) (5.526) (839) (708) Other comprehensive income items that are or may be reclassified subsequently to profit or loss Cash flow hedges (707) 2.581 (90) 331 Share of other comprehensive income of associates Exchange differences on translation of foreign operations Items that are or may not be reclassified subsequently to profit or loss: 227 (1,442) 211 691 29 27 (185) 89 Defined benefit plans Revaluation of equity investments designated at fair value through other comprehensive income (non-recycling) Other comprehensive income for the year, net of taxation Total comprehensive income for the year Total comprehensive income attributable to Ordinary shareholders of Cathay Pacific Preference shareholder of Cathay Pacific Non-controlling interests 108 510 14 65 (4) (5) (1) (1) 6 (1,818) 3.988 (8,365) (1.538) (1,072) (233) 511 (197) 20 (8,980) 614 (2.135) 596 (1,151) 79 (274) 77 (8,365) (1.538) (1,072) (197) CONSOLIDATED STATEMENT OF CASH FLOWS for the year ended 31st December 2022 Operating activities Note 2022 HK$M 2021 HK$M 2022 2021 US$M US$M Cash generated from operations Interest received Interest paid Tax paid Net cash inflow from operating activities 22 21,386 11,705 2,742 1,500 129 67 17 (2,432) (1,946) (313) 9 (249) (1,247) (991) (160) (127) 17,836 8,835 2,286 1,133 Investing activities Net (increase)/decrease in liquid funds other than cash and cash equivalents (183) 2,464 (23) 316 Proceeds from sales of property, plant and equipment 50 112 6 14 Net increase in other long-term receivables and investments Payments for property, plant and equipment and intangible assets Dividends received (17) (17) (2) (2) (3,729) (2,276) (478) (292) 1,096 140 23 (2,760) 210 493 3 27 (354) 63 Net repayments of loans to associates Net cash (outflow)/inflow from investing activities Financing activities New financing 11 Loan and lease repayments 6,115 13,906 11 (22,351) (20,838) 784 (2,865) 1,783 Net cash outflow from financing activities (16,236) (6,932) (2,081) (2,672) (889) Net (decrease)/increase in cash and cash equivalents (1,160) 2,396 (149) 307 Cash and cash equivalents at 1st January 8,573 6,166 1,099 791 Effect of exchange differences (73) 11 (9) 1 Cash and cash equivalents at 31st December 16 7,340 8,573 941 1,099 The financial statements are prepared and presented in HK$, the functional currency of Cathay Pacific. The US$ figures are shown only as supplementary information and are translated at US$1:HK$7.8. The notes on pages 77 to 127 and the principal accounting policies on pages 128 to 137 form part of these financial statements.
Step by Step Solution
There are 3 Steps involved in it
Step: 1

Get Instant Access to Expert-Tailored Solutions
See step-by-step solutions with expert insights and AI powered tools for academic success
Step: 2

Step: 3
Ace Your Homework with AI
Get the answers you need in no time with our AI-driven, step-by-step assistance
Get Started
International Financial Reporting and Analysis
Authors: David Alexander, Anne Britton, Ann Jorissen
5th edition
978-1408032282, 1408032287, 978-1408075012