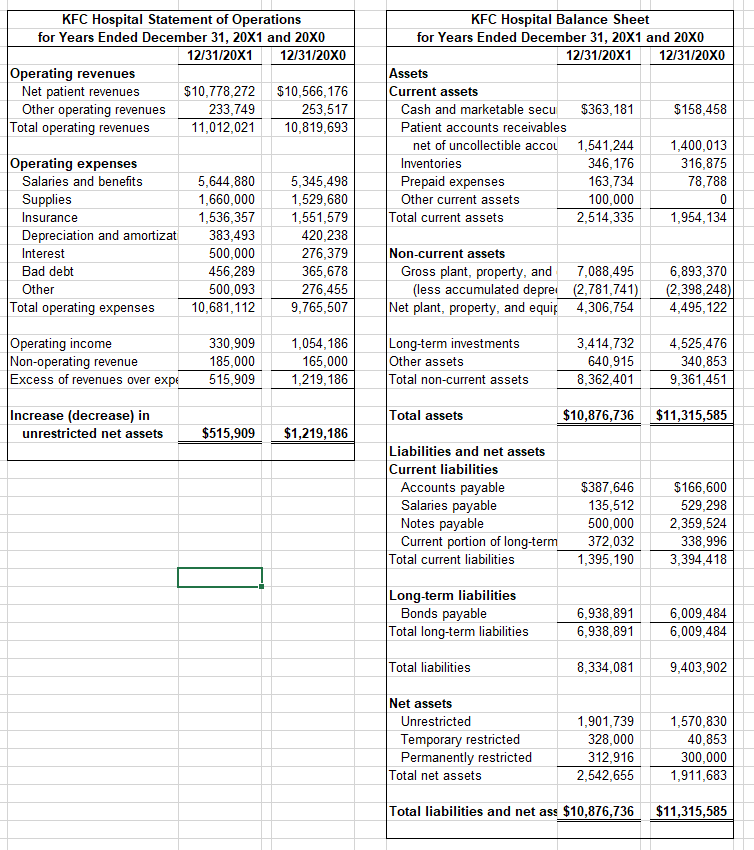
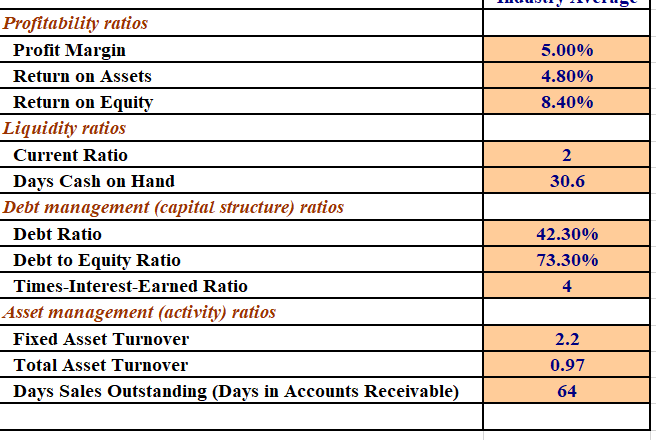
Construct a comparative ratio analysis worksheet.
1) Calculate the following ratios for both years data, using the Move or Copy function and the Copy and Paste function.
2) Create a worksheet as Compare with Standard, which calls the value from Ratio Analysis sheets with hospital 20X1 and 20X0 financial ratios. Then, place the ratio values in a separate column to compare them.
3) Discuss this hospitals current financial position and future outlook based upon these results and the industry standard. (You have to have the following columns: Desired Position, Current Year Position, Trend Position, and Possible Explanation Current Year Relative to Standards).
PLEASE RESPOND USING EXCEL FORMULAS AND EXCEL FORMAT 

KFC Hospital Statement of Operations for Years Ended December 31, 20X1 and 20X0 12/31/20X1 12/31/20X0 Operating revenues Net patient revenues $10,778,272 $10,566,176 Other operating revenues 233,749 253,517 Total operating revenues 11,012,021 10,819,693 KFC Hospital Balance Sheet for Years Ended December 31, 20X1 and 20X0 12/31/20X1 12/31/20X0 Assets Current assets Cash and marketable secu $363,181 $158,458 Patient accounts receivables net of uncollectible accou 1,541,244 1,400,013 Inventories 346,176 316,875 Prepaid expenses 163,734 78,788 Other current assets 100,000 0 Total current assets 2,514,335 1,954,134 Operating expenses Salaries and benefits Supplies Insurance Depreciation and amortizat Interest Bad debt Other Total operating expenses 5,644,880 1,660,000 1,536,357 383,493 500,000 456,289 500,093 10,681,112 5,345,498 1,529,680 1,551,579 420,238 276,379 365,678 276,455 9,765,507 Non-current assets Gross plant, property, and 7,088,495 (less accumulated depre (2,781,741) Net plant, property, and equip 4,306,754 6,893,370 (2,398,248) 4,495,122 Operating income Non-operating revenue Excess of revenues over expe 330,909 185,000 515,909 1,054,186 165,000 1,219,186 Long-term investments Other assets Total non-current assets 3,414,732 640,915 8,362,401 4,525,476 340,853 9,361,451 Total assets $10,876,736 $11,315,585 Increase (decrease) in unrestricted net assets $515,909 $1,219,186 Liabilities and net assets Current liabilities Accounts payable Salaries payable Notes payable Current portion of long-term Total current liabilities $387,646 135,512 500,000 372,032 1,395,190 $166,600 529,298 2,359,524 338,996 3,394,418 Long-term liabilities Bonds payable Total long-term liabilities 6,938,891 6,938,891 6,009,484 6,009,484 Total liabilities 8,334,081 9,403,902 Net assets Unrestricted Temporary restricted Permanently restricted Total net assets 1,901,739 328,000 312,916 2,542,655 1,570,830 40,853 300,000 1,911,683 Total liabilities and net ass $10,876,736 $11,315,585 5.00% 4.80% 8.40% 2 30.6 Profitability ratios Profit Margin Return on Assets Return on Equity Liquidity ratios Current Ratio Days Cash on Hand Debt management (capital structure) ratios Debt Ratio Debt to Equity Ratio Times Interest-Earned Ratio Asset management (activity) ratios Fixed Asset Turnover Total Asset Turnover Days Sales Outstanding (Days in Accounts Receivable) 42.30% 73.30% 4 2.2 0.97 64 KFC Hospital Statement of Operations for Years Ended December 31, 20X1 and 20X0 12/31/20X1 12/31/20X0 Operating revenues Net patient revenues $10,778,272 $10,566,176 Other operating revenues 233,749 253,517 Total operating revenues 11,012,021 10,819,693 KFC Hospital Balance Sheet for Years Ended December 31, 20X1 and 20X0 12/31/20X1 12/31/20X0 Assets Current assets Cash and marketable secu $363,181 $158,458 Patient accounts receivables net of uncollectible accou 1,541,244 1,400,013 Inventories 346,176 316,875 Prepaid expenses 163,734 78,788 Other current assets 100,000 0 Total current assets 2,514,335 1,954,134 Operating expenses Salaries and benefits Supplies Insurance Depreciation and amortizat Interest Bad debt Other Total operating expenses 5,644,880 1,660,000 1,536,357 383,493 500,000 456,289 500,093 10,681,112 5,345,498 1,529,680 1,551,579 420,238 276,379 365,678 276,455 9,765,507 Non-current assets Gross plant, property, and 7,088,495 (less accumulated depre (2,781,741) Net plant, property, and equip 4,306,754 6,893,370 (2,398,248) 4,495,122 Operating income Non-operating revenue Excess of revenues over expe 330,909 185,000 515,909 1,054,186 165,000 1,219,186 Long-term investments Other assets Total non-current assets 3,414,732 640,915 8,362,401 4,525,476 340,853 9,361,451 Total assets $10,876,736 $11,315,585 Increase (decrease) in unrestricted net assets $515,909 $1,219,186 Liabilities and net assets Current liabilities Accounts payable Salaries payable Notes payable Current portion of long-term Total current liabilities $387,646 135,512 500,000 372,032 1,395,190 $166,600 529,298 2,359,524 338,996 3,394,418 Long-term liabilities Bonds payable Total long-term liabilities 6,938,891 6,938,891 6,009,484 6,009,484 Total liabilities 8,334,081 9,403,902 Net assets Unrestricted Temporary restricted Permanently restricted Total net assets 1,901,739 328,000 312,916 2,542,655 1,570,830 40,853 300,000 1,911,683 Total liabilities and net ass $10,876,736 $11,315,585 5.00% 4.80% 8.40% 2 30.6 Profitability ratios Profit Margin Return on Assets Return on Equity Liquidity ratios Current Ratio Days Cash on Hand Debt management (capital structure) ratios Debt Ratio Debt to Equity Ratio Times Interest-Earned Ratio Asset management (activity) ratios Fixed Asset Turnover Total Asset Turnover Days Sales Outstanding (Days in Accounts Receivable) 42.30% 73.30% 4 2.2 0.97 64


