Answered step by step
Verified Expert Solution
Link Copied!

Question

1 Approved Answer

Construct a formula for below: Question 20 2014 2015 2020 2016 141.78 2018 160.80 2019 170.45 Revenue 2017 150.28 74.54 125.00 56.00 132.50 61.60 180.68

Construct a formula for below:
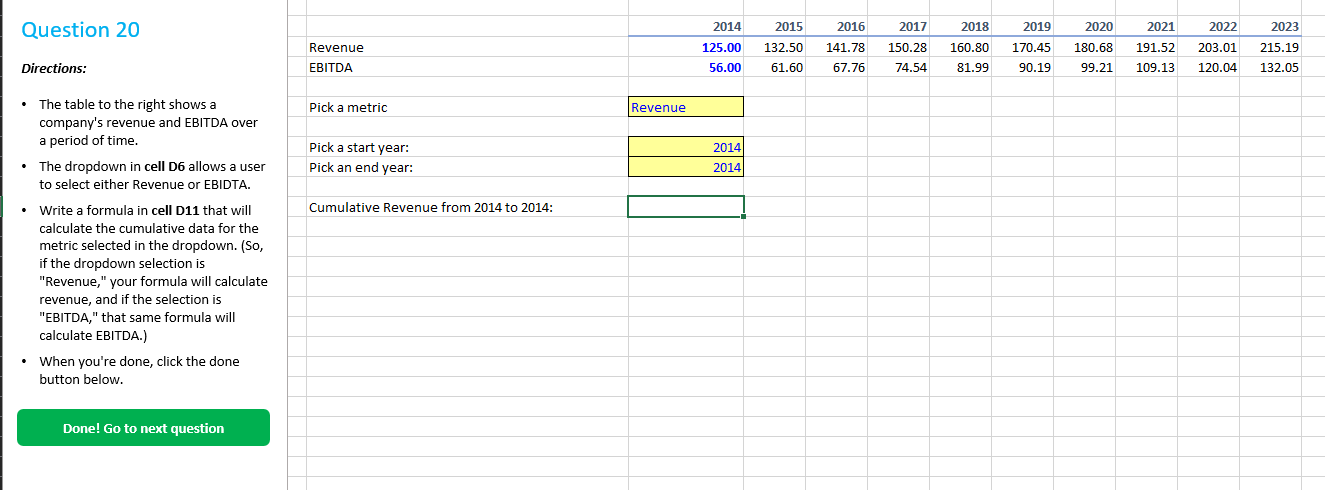
image text in transcribed

Question 20 2014 2015 2020 2016 141.78 2018 160.80 2019 170.45 Revenue 2017 150.28 74.54 125.00 56.00 132.50 61.60 180.68 99.21 2021 191.52 109.13 2022 203.01 120.04 2023 215.19 132.05 Directions: EBITDA 67.76 81.99 90.19 Pick a metric Revenue Pick a start year: Pick an end year: 2014 2014) Cumulative Revenue from 2014 to 2014: The table to the right shows a company's revenue and EBITDA over a period of time. The dropdown in cell D6 allows a user to select either Revenue or EBIDTA. Write a formula in cell D11 that will calculate the cumulative data for the metric selected in the dropdown. (So, if the dropdown selection is "Revenue," your formula will calculate revenue, and if the selection is "EBITDA," that same formula will calculate EBITDA.) When you're done, click the done button below. Done! Go to next

Step by Step Solution

There are 3 Steps involved in it

Step: 1

blur-text-image

Get Instant Access to Expert-Tailored Solutions

See step-by-step solutions with expert insights and AI powered tools for academic success

Step: 2

blur-text-image_2

Step: 3

blur-text-image_3

Ace Your Homework with AI

Get the answers you need in no time with our AI-driven, step-by-step assistance

Get Started

Recommended Textbook for

Personal Finance

Authors: Jeff Madura

4th Edition

0136117007, 9780136117001

More Books

Students also viewed these Finance questions

Question

2. Fostering an atmosphere of trust.

Answered: 1 week ago