- Construct a free cash flow valuation model for the next 4 years. Assume a terminal value in year 4 of 9 times EBITDA. What is your estimate of value today? Compare your estimate of value to the one given in the case. How does your proposed dividend policy affect the price?
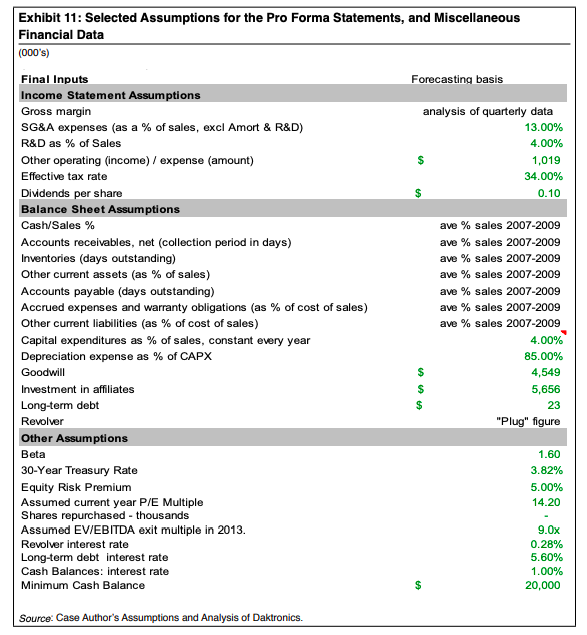
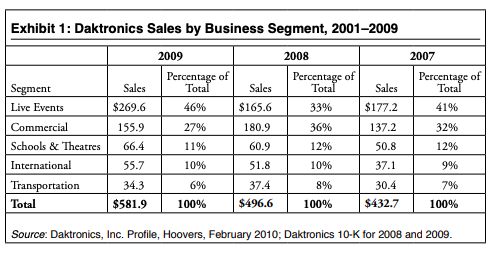
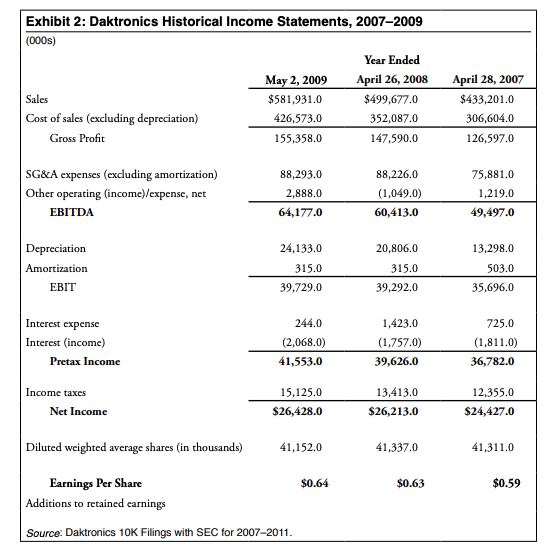
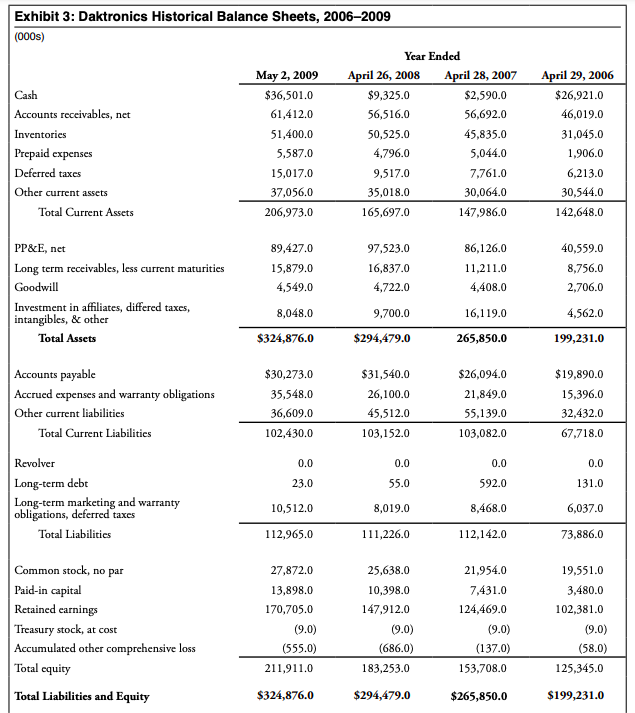
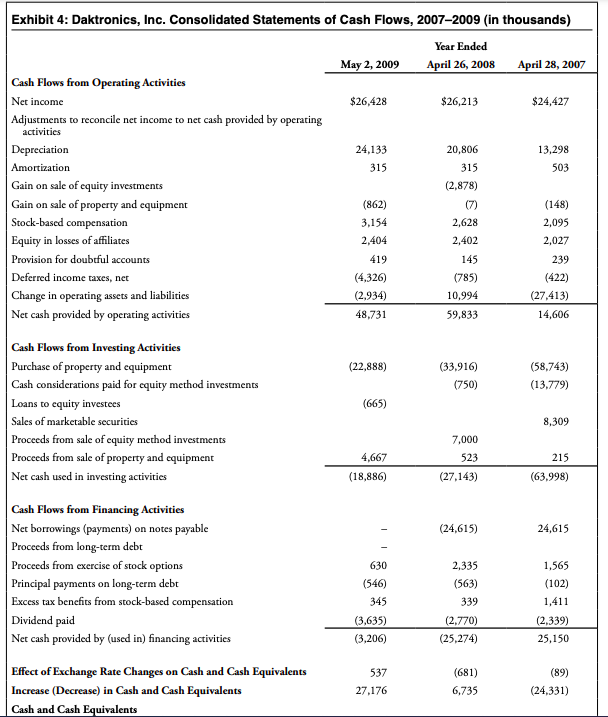
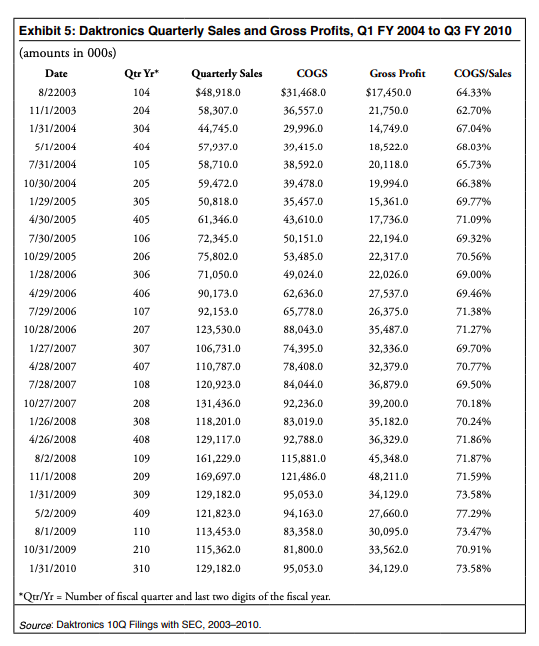
Exhibit 11: Selected Assumptions for the Pro Forma Statements, and Miscellaneous Financial Data (000's) Forecasting basis Final Inputs Income Statement Assumptions Gross margin SG&A expenses (as a % of sales, excl Amort & R&D) R&D as % of Sales analysis of quarterly data 13.00% 4.00% Other operating (income) / expense (amount) 1,019 Effective tax rate 34.00% 0.10 Dividends per share Balance Sheet Assumptions Cash/Sales % ave % sales 2007-2009 ave % sales 2007-2009 ave % sales 2007-2009 ave % sales 2007-2009 ave % sales 2007-2009 Accounts receivables, net (collection period in days) Inventories (days outstanding) Other current assets (as % of sales) Accounts payable (days outstanding) Accrued expenses and warranty obligations (as % of cost of sales) Other current liabilities (as % of cost of sales) Capital expenditures as % of sales, constant every year Depreciation expense as % of CAPX Goodwill ave % sales 2007-2009 ave % sales 2007-2009 4.00% 85.00% 4,549 5,656 Investment in affiliates Long-term debt $ 23 Revolver "Plug" figure Other Assumptions Beta 1.60 3.82% 5.00% 14.20 30-Year Treasury Rate Equity Risk Premium Assumed current year P/E Multiple Shares repurchased - thousands Assumed EV/EBITDA exit multiple in 2013. Revolver interest rate Long-term debt interest rate Cash Balances: Interest rate 9.Ox 0.28% 5.60% 1.00% Minimum Cash Balance $ 20,000 Source: Case Author's Assumptions and Analysis of Daktronics. Exhibit 1: Daktronics Sales by Business Segment, 2001-2009 2009 2008 2007 Percentage of Total Percentage of Total Percentage of Total Segment Sales Sales Sales Live Events $269.6 46% $165.6 33% $177.2 41% Commercial 155.9 27% 180.9 36% 137.2 32% Schools & Theatres 66.4 11% 60.9 12% 50.8 12% International 55.7 10% 51.8 10% 37.1 9% 34.3 6% 37.4 8% 30.4 7% Transportation Total $581.9 100% $496.6 100% $432.7 100% Source: Daktronics, Inc. Profile, Hoovers, February 2010; Daktronics 10-K for 2008 and 2009. Exhibit 2: Daktronics Historical Income Statements, 2007-2009 (000s) Year Ended May 2, 2009 April 26, 2008 $499,677.0 Cost of sales (excluding depreciation) April 28, 2007 $433,201.0 Sales $581,931.0 426,573.0 352,087.0 306,604.0 Gross Profit 155,358.0 147.590.0 126,597.0 88,293.0 88,226.0 75,881.0 SG&A expenses (excluding amortization) Other operating (income)/expense, net EBITDA 2,888.0 (1,049.0) 1,219.0 64,177.0 60,413.0 49,497.0 Depreciation 24,133.0 20,806.0 13,298.0 Amortization 315.0 315.0 503.0 EBIT 39.729.0 39,292.0 35,696.0 Interest expense 244.0 1,423.0 725.0 Interest (income) (2,068.0) (1.757.0) (1,811.0) 36,782.0 Pretax Income 41,553.0 39,626.0 Income taxes 15,125.0 13,413.0 12,355.0 Net Income $26,428.0 $26,213.0 $24,427.0 Diluted weighted average shares (in thousands) 41,152.0 41,337.0 41,311.0 $0.64 $0.63 $0.59 Earnings Per Share Additions to retained earnings Source: Daktronics 10K Filings with SEC for 2007-2011. Exhibit 3: Daktronics Historical Balance Sheets, 2006-2009 (000s) Year Ended May 2, 2009 April 26, 2008 April 28, 2007 April 29, 2006 Cash $36,501.0 $9,325.0 $2,590.0 $26,921.0 Accounts receivables, net 61,412.0 56,516.0 56,692.0 46,019.0 Inventories 51,400.0 50,525.0 45,835.0 31,045.0 5,587.0 4.796.0 5,044.0 1,906.0 Prepaid expenses Deferred taxes 15,017.0 9,517.0 7,761.0 6,213.0 Other current assets 37,056.0 35,018.0 30,064.0 30,544.0 Total Current Assets 206,973.0 165,697.0 147,986.0 142,648.0 PP&E, net 89,427.0 97,523.0 86,126.0 40,559.0 15,879.0 16,837.0 11,211.0 8,756.0 4,549.0 4,722.0 4,408.0 2,706.0 Long term receivables, less current maturities Goodwill Investment in affiliates, differed taxes, intangibles, & other Total Assets 8,048.0 9,700.0 16,119.0 4,562.0 $324,876.0 $294,479.0 265,850.0 199,231.0 $30,273.0 $31,540.0 $26,094.0 $19,890.0 Accounts payable Accrued expenses and warranty obligations Other current liabilities 35,548.0 26,100.0 21,849.0 15,396.0 36,609.0 45,512.0 55,139.0 32,432.0 Total Current Liabilities 102,430.0 103,152.0 103,082.0 67,718.0 Revolver 0.0 0.0 0.0 0.0 23.0 55.0 592.0 131.0 Long-term debt Long-term marketing and warranty obligations, deferred taxes 10,512.0 8,019.0 8,468.0 6,037.0 Total Liabilities 112,965.0 111,226.0 112,142.0 73,886.0 27,872.0 25,638.0 21,954.0 19,551.0 13,898.0 10,398.0 7,431.0 3,480.0 170,705.0 147,912.0 124,469.0 102,381.0 Common stock, no par Paid-in capital Retained earnings Treasury stock, at cost Accumulated other comprehensive loss Total equity (9.0) (9.0) (9.0) (9.0) (555.0) (686.0) (137.0) (58.0) 211,911.0 183,253.0 153,708.0 125,345.0 Total Liabilities and Equity $324,876.0 $294,479.0 $265,850.0 $199,231.0 Exhibit 4: Daktronics, Inc. Consolidated Statements of Cash Flows, 2007-2009 (in thousands) Year Ended May 2, 2009 April 26, 2008 April 28, 2007 Cash Flows from Operating Activities Net income $26.428 $26,213 $24,427 Adjustments to reconcile net income to net cash provided by operating activities Depreciation 24,133 20,806 13,298 Amortization 315 315 503 (2.878) (862) (7) (148) Gain on sale of equity investments Gain on sale of property and equipment Stock-based compensation Equity in losses of affiliates 3.154 2,628 2,095 2,404 2,402 2,027 Provision for doubtful accounts 419 145 239 Deferred income taxes, net (4,326) (785) (422) Change in operating assets and liabilities (2,934) 10,994 (27,413) Net cash provided by operating activities 48,731 59,833 14,606 (22,888) (33.916) (58.743) Cash Flows from Investing Activities Purchase of property and equipment Cash considerations paid for equity method investments Loans to equity investees (750) (13.779) (665) Sales of marketable securities 8,309 7.000 Proceeds from sale of equity method investments Proceeds from sale of property and equipment Net cash used in investing activities 4,667 523 215 (18,886) (27.143) (63.998) (24,615) 24,615 630 2,335 1,565 Cash Flows from Financing Activities Net borrowings (payments) on notes payable Proceeds from long-term debt Proceeds from exercise of stock options Principal payments on long-term debt Excess tax benefits from stock-based compensation Dividend paid Net cash provided by (used in) financing activities (546) (563) (102) 345 339 1,411 (3,635) (2.770) (2,339) 25,150 (3,206) (25,274) 537 (89) Effect of Exchange Rate Changes on Cash and Cash Equivalents Increase (Decrease) in Cash and Cash Equivalents Cash and Cash Equivalents (681) 6,735 27.176 (24,331) Exhibit 5: Daktronics Quarterly Sales and Gross Profits, Q1 FY 2004 to Q3 FY 2010 (amounts in 000s) Qtr Yr* Quarterly Sales Date COGS Gross Profit COGS/Sales 8/22003 104 $48,918.0 $31,468.0 $17,450.0 64.33% 11/1/2003 204 58,307.0 36,557.0 21,750.0 62.70% 1/31/2004 304 44.745.0 29.996.0 14,749.0 67.04% 5/1/2004 404 57,937.0 39,415.0 18,522.0 68.0396 7/31/2004 105 58.710.0 38,592.0 20.118.0 65.73% 10/30/2004 205 59.472.0 39.478.0 19.994.0 66.38% 1/29/2005 305 50.818.0 35,457.0 15,361.0 69.77% 4/30/2005 405 61,346.0 43,610.0 17.736.0 71.09% 7/30/2005 106 72,345.0 50,151.0 22,194.0 69.32% 10/29/2005 206 75,802.0 53.485.0 22,317.0 70.56% 1/28/2006 306 71,050.0 49,024.0 22,026,0 69.00% 4/29/2006 406 90,173.0 62,636.0 27.537.0 69.46% 7/29/2006 107 92,153.0 65,778.0 26,375.0 71.38% 10/28/2006 207 123,530.0 88,043.0 35,487.0 71.27% 1/27/2007 307 106,731.0 74,395.0 32,336,0 69.70% 4/28/2007 407 110,787.0 78,408.0 32,379.0 70.77% 7/28/2007 108 120,923.0 84,044.0 36,879.0 69.50% 10/27/2007 208 131,436.0 92,236.0 39,200.0 70.18% 1/26/2008 308 118,201.0 83.019.0 35.182.0 70.24% 4/26/2008 408 129,117.0 92,788.0 36,329.0 71.86% 8/2/2008 109 161,229.0 115,881.0 45,348.0 71.87% 11/1/2008 209 169,697.0 121,486.0 48,211.0 71.59% 1/31/2009 309 129,182.0 95.053.0 34,129.0 73.58% 5/2/2009 409 121,823.0 94,163.0 27,660.0 77.29% 8/1/2009 110 113,453.0 83.358.0 30,095.0 73.47% 10/31/2009 210 115.362.0 81,800.0 33.562.0 70.91% 1/31/2010 310 129,182.0 95,053.0 34,129.0 73.58% "Qu/Yr = Number of fiscal quarter and last two digits of the fiscal year. Source: Daktronics 100 Filings with SEC, 2003-2010. Exhibit 11: Selected Assumptions for the Pro Forma Statements, and Miscellaneous Financial Data (000's) Forecasting basis Final Inputs Income Statement Assumptions Gross margin SG&A expenses (as a % of sales, excl Amort & R&D) R&D as % of Sales analysis of quarterly data 13.00% 4.00% Other operating (income) / expense (amount) 1,019 Effective tax rate 34.00% 0.10 Dividends per share Balance Sheet Assumptions Cash/Sales % ave % sales 2007-2009 ave % sales 2007-2009 ave % sales 2007-2009 ave % sales 2007-2009 ave % sales 2007-2009 Accounts receivables, net (collection period in days) Inventories (days outstanding) Other current assets (as % of sales) Accounts payable (days outstanding) Accrued expenses and warranty obligations (as % of cost of sales) Other current liabilities (as % of cost of sales) Capital expenditures as % of sales, constant every year Depreciation expense as % of CAPX Goodwill ave % sales 2007-2009 ave % sales 2007-2009 4.00% 85.00% 4,549 5,656 Investment in affiliates Long-term debt $ 23 Revolver "Plug" figure Other Assumptions Beta 1.60 3.82% 5.00% 14.20 30-Year Treasury Rate Equity Risk Premium Assumed current year P/E Multiple Shares repurchased - thousands Assumed EV/EBITDA exit multiple in 2013. Revolver interest rate Long-term debt interest rate Cash Balances: Interest rate 9.Ox 0.28% 5.60% 1.00% Minimum Cash Balance $ 20,000 Source: Case Author's Assumptions and Analysis of Daktronics. Exhibit 1: Daktronics Sales by Business Segment, 2001-2009 2009 2008 2007 Percentage of Total Percentage of Total Percentage of Total Segment Sales Sales Sales Live Events $269.6 46% $165.6 33% $177.2 41% Commercial 155.9 27% 180.9 36% 137.2 32% Schools & Theatres 66.4 11% 60.9 12% 50.8 12% International 55.7 10% 51.8 10% 37.1 9% 34.3 6% 37.4 8% 30.4 7% Transportation Total $581.9 100% $496.6 100% $432.7 100% Source: Daktronics, Inc. Profile, Hoovers, February 2010; Daktronics 10-K for 2008 and 2009. Exhibit 2: Daktronics Historical Income Statements, 2007-2009 (000s) Year Ended May 2, 2009 April 26, 2008 $499,677.0 Cost of sales (excluding depreciation) April 28, 2007 $433,201.0 Sales $581,931.0 426,573.0 352,087.0 306,604.0 Gross Profit 155,358.0 147.590.0 126,597.0 88,293.0 88,226.0 75,881.0 SG&A expenses (excluding amortization) Other operating (income)/expense, net EBITDA 2,888.0 (1,049.0) 1,219.0 64,177.0 60,413.0 49,497.0 Depreciation 24,133.0 20,806.0 13,298.0 Amortization 315.0 315.0 503.0 EBIT 39.729.0 39,292.0 35,696.0 Interest expense 244.0 1,423.0 725.0 Interest (income) (2,068.0) (1.757.0) (1,811.0) 36,782.0 Pretax Income 41,553.0 39,626.0 Income taxes 15,125.0 13,413.0 12,355.0 Net Income $26,428.0 $26,213.0 $24,427.0 Diluted weighted average shares (in thousands) 41,152.0 41,337.0 41,311.0 $0.64 $0.63 $0.59 Earnings Per Share Additions to retained earnings Source: Daktronics 10K Filings with SEC for 2007-2011. Exhibit 3: Daktronics Historical Balance Sheets, 2006-2009 (000s) Year Ended May 2, 2009 April 26, 2008 April 28, 2007 April 29, 2006 Cash $36,501.0 $9,325.0 $2,590.0 $26,921.0 Accounts receivables, net 61,412.0 56,516.0 56,692.0 46,019.0 Inventories 51,400.0 50,525.0 45,835.0 31,045.0 5,587.0 4.796.0 5,044.0 1,906.0 Prepaid expenses Deferred taxes 15,017.0 9,517.0 7,761.0 6,213.0 Other current assets 37,056.0 35,018.0 30,064.0 30,544.0 Total Current Assets 206,973.0 165,697.0 147,986.0 142,648.0 PP&E, net 89,427.0 97,523.0 86,126.0 40,559.0 15,879.0 16,837.0 11,211.0 8,756.0 4,549.0 4,722.0 4,408.0 2,706.0 Long term receivables, less current maturities Goodwill Investment in affiliates, differed taxes, intangibles, & other Total Assets 8,048.0 9,700.0 16,119.0 4,562.0 $324,876.0 $294,479.0 265,850.0 199,231.0 $30,273.0 $31,540.0 $26,094.0 $19,890.0 Accounts payable Accrued expenses and warranty obligations Other current liabilities 35,548.0 26,100.0 21,849.0 15,396.0 36,609.0 45,512.0 55,139.0 32,432.0 Total Current Liabilities 102,430.0 103,152.0 103,082.0 67,718.0 Revolver 0.0 0.0 0.0 0.0 23.0 55.0 592.0 131.0 Long-term debt Long-term marketing and warranty obligations, deferred taxes 10,512.0 8,019.0 8,468.0 6,037.0 Total Liabilities 112,965.0 111,226.0 112,142.0 73,886.0 27,872.0 25,638.0 21,954.0 19,551.0 13,898.0 10,398.0 7,431.0 3,480.0 170,705.0 147,912.0 124,469.0 102,381.0 Common stock, no par Paid-in capital Retained earnings Treasury stock, at cost Accumulated other comprehensive loss Total equity (9.0) (9.0) (9.0) (9.0) (555.0) (686.0) (137.0) (58.0) 211,911.0 183,253.0 153,708.0 125,345.0 Total Liabilities and Equity $324,876.0 $294,479.0 $265,850.0 $199,231.0 Exhibit 4: Daktronics, Inc. Consolidated Statements of Cash Flows, 2007-2009 (in thousands) Year Ended May 2, 2009 April 26, 2008 April 28, 2007 Cash Flows from Operating Activities Net income $26.428 $26,213 $24,427 Adjustments to reconcile net income to net cash provided by operating activities Depreciation 24,133 20,806 13,298 Amortization 315 315 503 (2.878) (862) (7) (148) Gain on sale of equity investments Gain on sale of property and equipment Stock-based compensation Equity in losses of affiliates 3.154 2,628 2,095 2,404 2,402 2,027 Provision for doubtful accounts 419 145 239 Deferred income taxes, net (4,326) (785) (422) Change in operating assets and liabilities (2,934) 10,994 (27,413) Net cash provided by operating activities 48,731 59,833 14,606 (22,888) (33.916) (58.743) Cash Flows from Investing Activities Purchase of property and equipment Cash considerations paid for equity method investments Loans to equity investees (750) (13.779) (665) Sales of marketable securities 8,309 7.000 Proceeds from sale of equity method investments Proceeds from sale of property and equipment Net cash used in investing activities 4,667 523 215 (18,886) (27.143) (63.998) (24,615) 24,615 630 2,335 1,565 Cash Flows from Financing Activities Net borrowings (payments) on notes payable Proceeds from long-term debt Proceeds from exercise of stock options Principal payments on long-term debt Excess tax benefits from stock-based compensation Dividend paid Net cash provided by (used in) financing activities (546) (563) (102) 345 339 1,411 (3,635) (2.770) (2,339) 25,150 (3,206) (25,274) 537 (89) Effect of Exchange Rate Changes on Cash and Cash Equivalents Increase (Decrease) in Cash and Cash Equivalents Cash and Cash Equivalents (681) 6,735 27.176 (24,331) Exhibit 5: Daktronics Quarterly Sales and Gross Profits, Q1 FY 2004 to Q3 FY 2010 (amounts in 000s) Qtr Yr* Quarterly Sales Date COGS Gross Profit COGS/Sales 8/22003 104 $48,918.0 $31,468.0 $17,450.0 64.33% 11/1/2003 204 58,307.0 36,557.0 21,750.0 62.70% 1/31/2004 304 44.745.0 29.996.0 14,749.0 67.04% 5/1/2004 404 57,937.0 39,415.0 18,522.0 68.0396 7/31/2004 105 58.710.0 38,592.0 20.118.0 65.73% 10/30/2004 205 59.472.0 39.478.0 19.994.0 66.38% 1/29/2005 305 50.818.0 35,457.0 15,361.0 69.77% 4/30/2005 405 61,346.0 43,610.0 17.736.0 71.09% 7/30/2005 106 72,345.0 50,151.0 22,194.0 69.32% 10/29/2005 206 75,802.0 53.485.0 22,317.0 70.56% 1/28/2006 306 71,050.0 49,024.0 22,026,0 69.00% 4/29/2006 406 90,173.0 62,636.0 27.537.0 69.46% 7/29/2006 107 92,153.0 65,778.0 26,375.0 71.38% 10/28/2006 207 123,530.0 88,043.0 35,487.0 71.27% 1/27/2007 307 106,731.0 74,395.0 32,336,0 69.70% 4/28/2007 407 110,787.0 78,408.0 32,379.0 70.77% 7/28/2007 108 120,923.0 84,044.0 36,879.0 69.50% 10/27/2007 208 131,436.0 92,236.0 39,200.0 70.18% 1/26/2008 308 118,201.0 83.019.0 35.182.0 70.24% 4/26/2008 408 129,117.0 92,788.0 36,329.0 71.86% 8/2/2008 109 161,229.0 115,881.0 45,348.0 71.87% 11/1/2008 209 169,697.0 121,486.0 48,211.0 71.59% 1/31/2009 309 129,182.0 95.053.0 34,129.0 73.58% 5/2/2009 409 121,823.0 94,163.0 27,660.0 77.29% 8/1/2009 110 113,453.0 83.358.0 30,095.0 73.47% 10/31/2009 210 115.362.0 81,800.0 33.562.0 70.91% 1/31/2010 310 129,182.0 95,053.0 34,129.0 73.58% "Qu/Yr = Number of fiscal quarter and last two digits of the fiscal year. Source: Daktronics 100 Filings with SEC, 2003-2010


