

Answered step by step
Verified Expert Solution
Question
1 Approved Answer
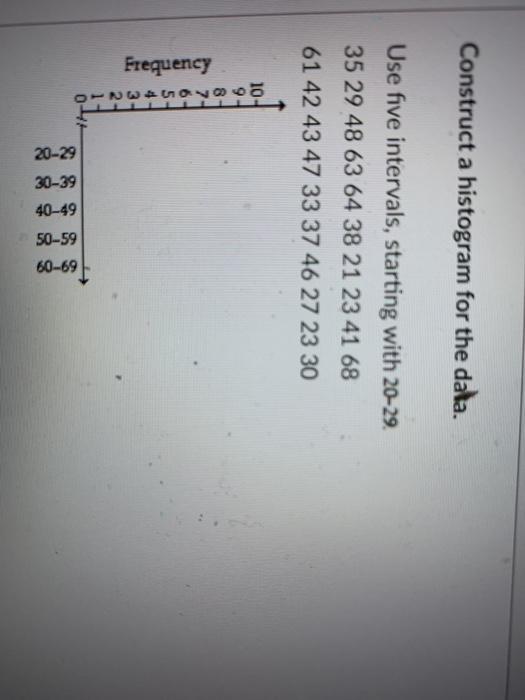
Construct a histogram for the data. Use five intervals, starting with 20-29. 35 29 48 63 64 38 21 23 41 68 61 42 43
Step by Step Solution
There are 3 Steps involved in it
Step: 1

Get Instant Access to Expert-Tailored Solutions
See step-by-step solutions with expert insights and AI powered tools for academic success
Step: 2

Step: 3
Ace Your Homework with AI
Get the answers you need in no time with our AI-driven, step-by-step assistance
Get Started
Accounting and auditing research tools and strategies
Authors: Thomas Weirich, Thomas Pearson, Natalie Tatiana
8th edition
9781118806487, 1118027078, 1118806484, 978-1118027073