Answered step by step
Verified Expert Solution
Link Copied!

Question

1 Approved Answer

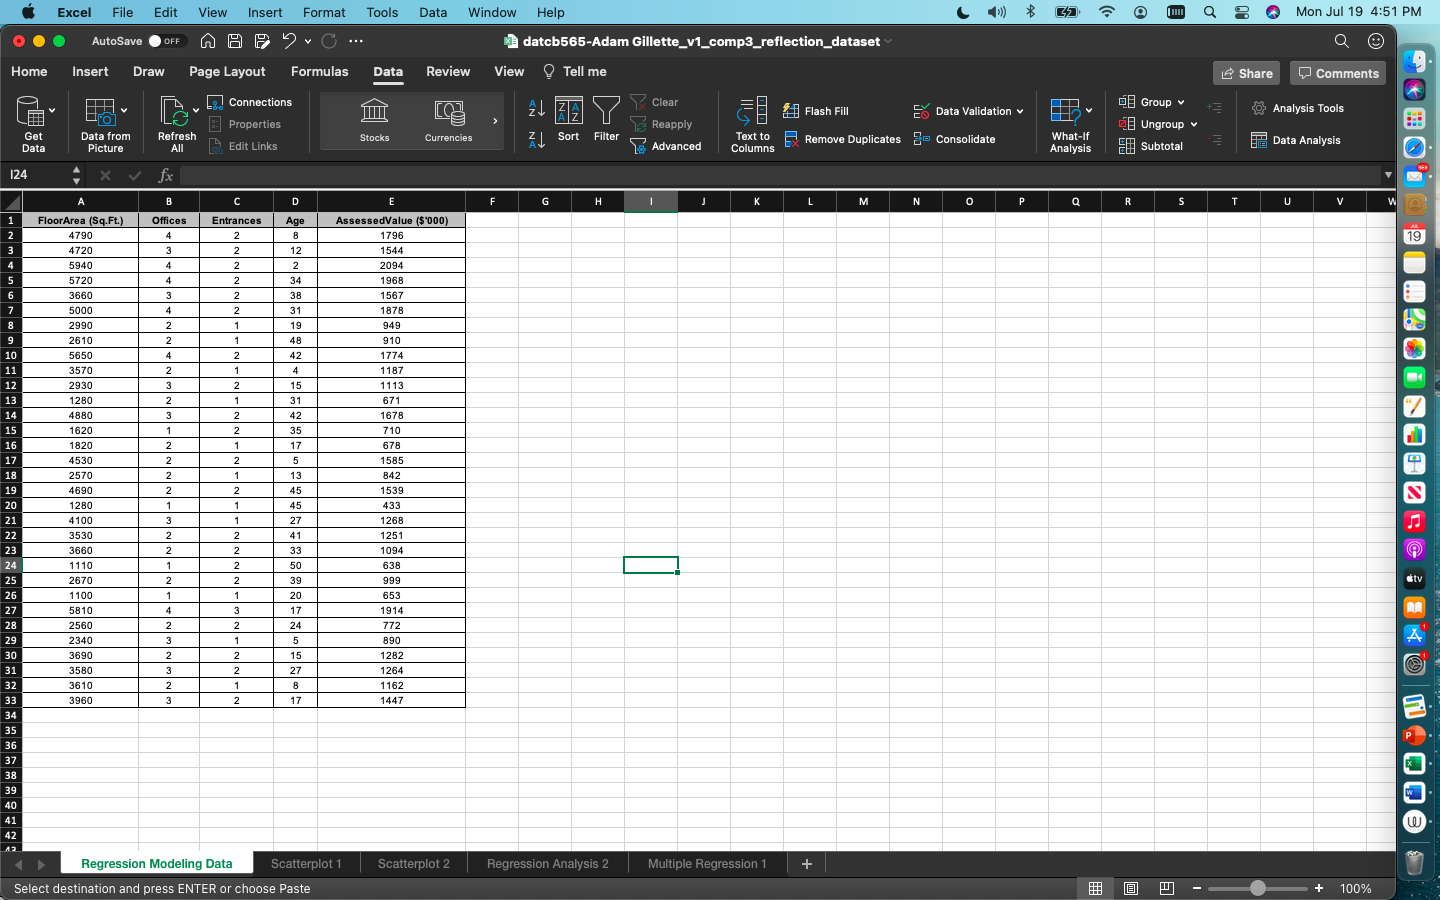
Construct a multiple regression model. Use Excel's Analysis ToolPak to conduct a regression analysis with AssessmentValue as the dependent variable and FloorArea, Offices, Entrances, and

Construct a multiple regression model.

  • Use Excel's Analysis ToolPak to conduct a regression analysis with AssessmentValue as the dependent variable and FloorArea, Offices, Entrances, and Age as independent variables.
  • What is the overall fit R2? What is the adjusted R2?
  • Which predictors are considered significant if we work with ?=0.05? Which predictors can be eliminated?
  • What is the final model if we only use FloorArea and Offices as predictors?
  • Suppose our final model is: AssessedValue = 115.9 + 0.26 x FloorArea + 78.34 x Offices.
  • What would be the assessed value of a medical office building with a floor area of 3500 sq. ft., 2 offices, that was built 15 years ago?
  • Is this assessed value consistent with what appears in the database?

image text in transcribed
Excel File Edit View Insert Format Tools Data Window Help 6 1 1) $ 45 9 1 Q 2 @ Mon Jul 19 4:51 PM AutoSave . OFF n BE ? ' C ... datcb565-Adam Gillette_v1_comp3_reflection_dataset Q Home Insert Draw Page Layout Formulas Data Review View Tell me Share Comments ga Connections Clear Flash Fill Group v Data Validation 0 Analysis Tools Properties Reapply a Ungroup Get Data from Refresh Stocks Currencies Edit Links J. Sort Filter Text to What-If E Data Picture All Advanced Ex Remove Duplicates - Consolidate Data Analysis Columns Analysis Subtotal 124 X V fx B D G H M N 0 P Q R T U V FloorArea (Sq.Ft.) Offices Entrances Age AssessedValue ($'000) 4790 2 8 1796 19 4720 2 12 1544 5940 2 2094 5720 34 1968 3660 2 38 1567 500 2 31 1878 2990 19 949 2610 910 5650 1774 3570 1187 2930 1113 1280 671 4880 1678 1620 710 1820 678 4530 1585 2570 W N W N W N A - N - N N W - N N N N - W N W N A N N A W A A W 842 4690 1539 1280 433 4100 1268 3530 1251 3660 N - N N - N W - N N N N - - N - N - N N- 1094 1110 638 2670 999 1100 653 5810 1914 2560 772 2340 890 3690 1282 3580 1264 3610 1 162 3960 1447 Regression Modeling Data Scatterplot 1 Scatterplot 2 Regression Analysis 2 Multiple Regression 1 + Select destination and press ENTER or choose Paste 100%

Step by Step Solution

There are 3 Steps involved in it

Step: 1

blur-text-image

Get Instant Access to Expert-Tailored Solutions

See step-by-step solutions with expert insights and AI powered tools for academic success

Step: 2

blur-text-image

Step: 3

blur-text-image

Ace Your Homework with AI

Get the answers you need in no time with our AI-driven, step-by-step assistance

Get Started

Recommended Textbook for

More Books

Students also viewed these Mathematics questions

Question

Name this molecule. C-C-C-C-C

Answered: 1 week ago

Question

List the steps of process improvement.

Answered: 1 week ago