

Question
Construct a plot of ln( K sp ) vs 1 T using your data from the above table. From the graph determine the slope and
Construct a plot of ln(Ksp) vs 1T using your data from the above table. From the graph determine the slope and evaluate H. For the R-value, use 8.314 Jmol1K1.
(i) slope = H/R
(ii) H Jmol1
(b) From your plot of ln(Ksp) vs 1T, find the y-intercept to determine S.
(i)SR = ln(Ksp) + HRT
(ii) S (Use the data you entered for 25 mL to solve for S.)
Jmol1K1
c) Using your experimentally determined H and S, determine the G at 60.0C.
Jmol1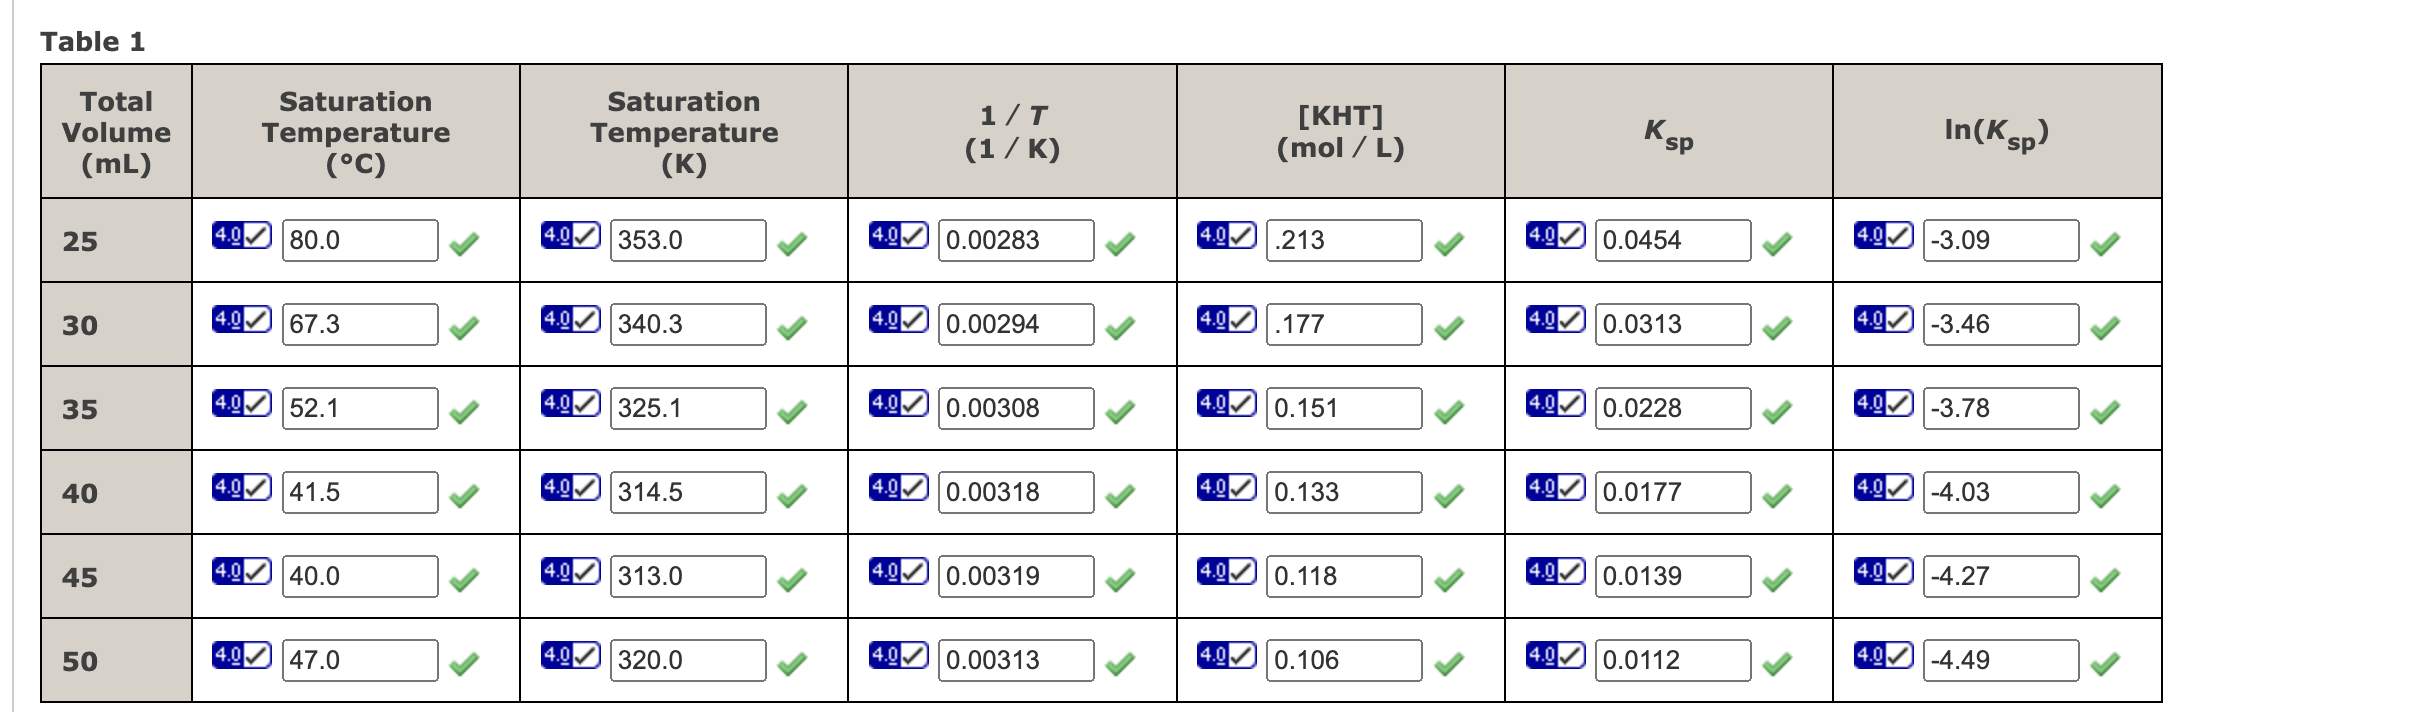
Step by Step Solution
There are 3 Steps involved in it
Step: 1

Get Instant Access to Expert-Tailored Solutions
See step-by-step solutions with expert insights and AI powered tools for academic success
Step: 2

Step: 3
Ace Your Homework with AI
Get the answers you need in no time with our AI-driven, step-by-step assistance
Get Started
Transport Processes And Separation Process Principles
Authors: Christie Geankoplis, Allen Hersel, Daniel Lepek
5th Edition
0134181026, 978-0134181028