Answered step by step
Verified Expert Solution
Question
1 Approved Answer
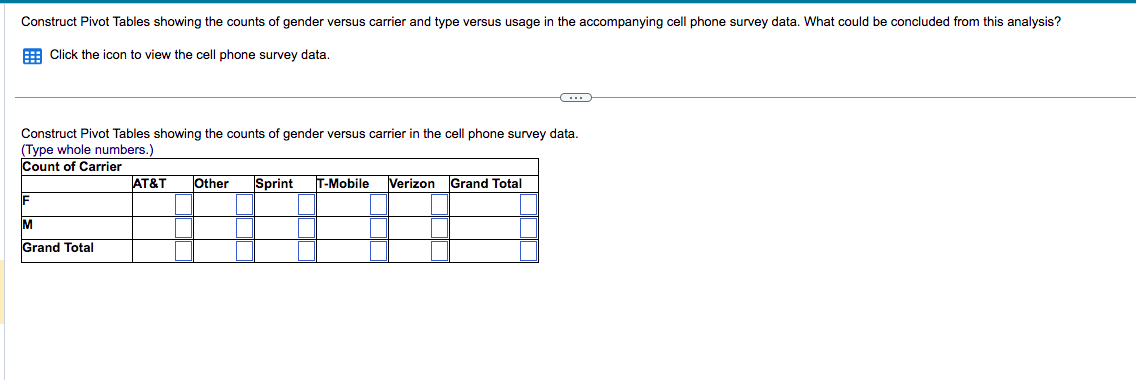
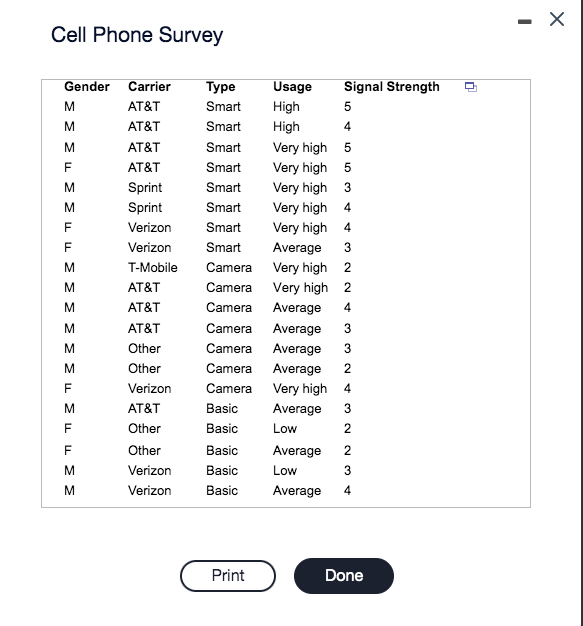
Construct Pivot Tables showing the counts of gender versus carrier and type versus usage in the accompanying cell phone survey data. What could be concluded


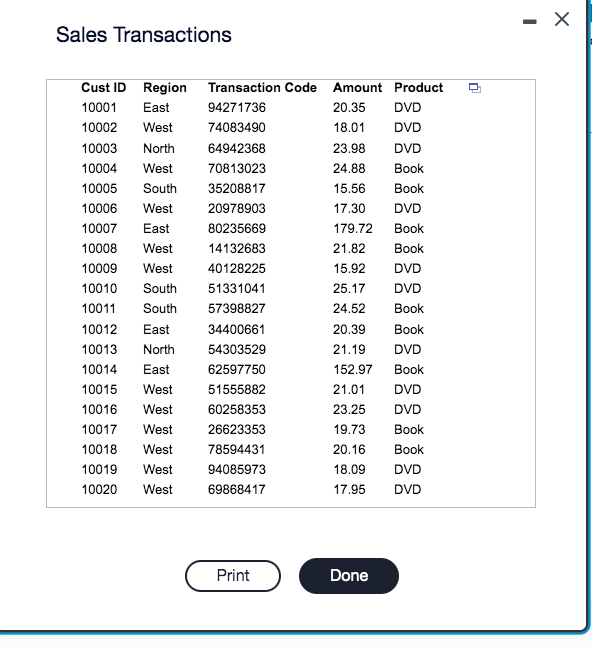
Construct Pivot Tables showing the counts of gender versus carrier and type versus usage in the accompanying cell phone survey data. What could be concluded from this analysis? Click the icon to view the cell phone survey data. Construct Pivot Tables showing the counts of gender versus carrier in the cell phone survey data. (Type whole numbers.) Cell Phone Survey Use PivotTables to find the number of sales transactions by product and region, total amount of revenue by region, and total amount of revenue by region and product in the accompanying Sales Transactions data. Click the icon to view the Sales Transactions data. Use PivotTables to find the number of sales transactions by product and region. (Type whole numbers.) Sales Transactions
Step by Step Solution
There are 3 Steps involved in it
Step: 1

Get Instant Access to Expert-Tailored Solutions
See step-by-step solutions with expert insights and AI powered tools for academic success
Step: 2

Step: 3

Ace Your Homework with AI
Get the answers you need in no time with our AI-driven, step-by-step assistance
Get Started


