

Question
Consult the Consolidated Heat Transter, Inc. Statements of Income and the above excerpts from the 10-K report. Analyze the profitability of CHT by applying the
Consult the Consolidated Heat Transter, Inc. Statements of Income and the above excerpts from the 10-K report. Analyze the profitability of CHT by applying the following calculations for the three vears:
- common-size income statements
- Effective tax rates
- Growth rate of sales and operating costs
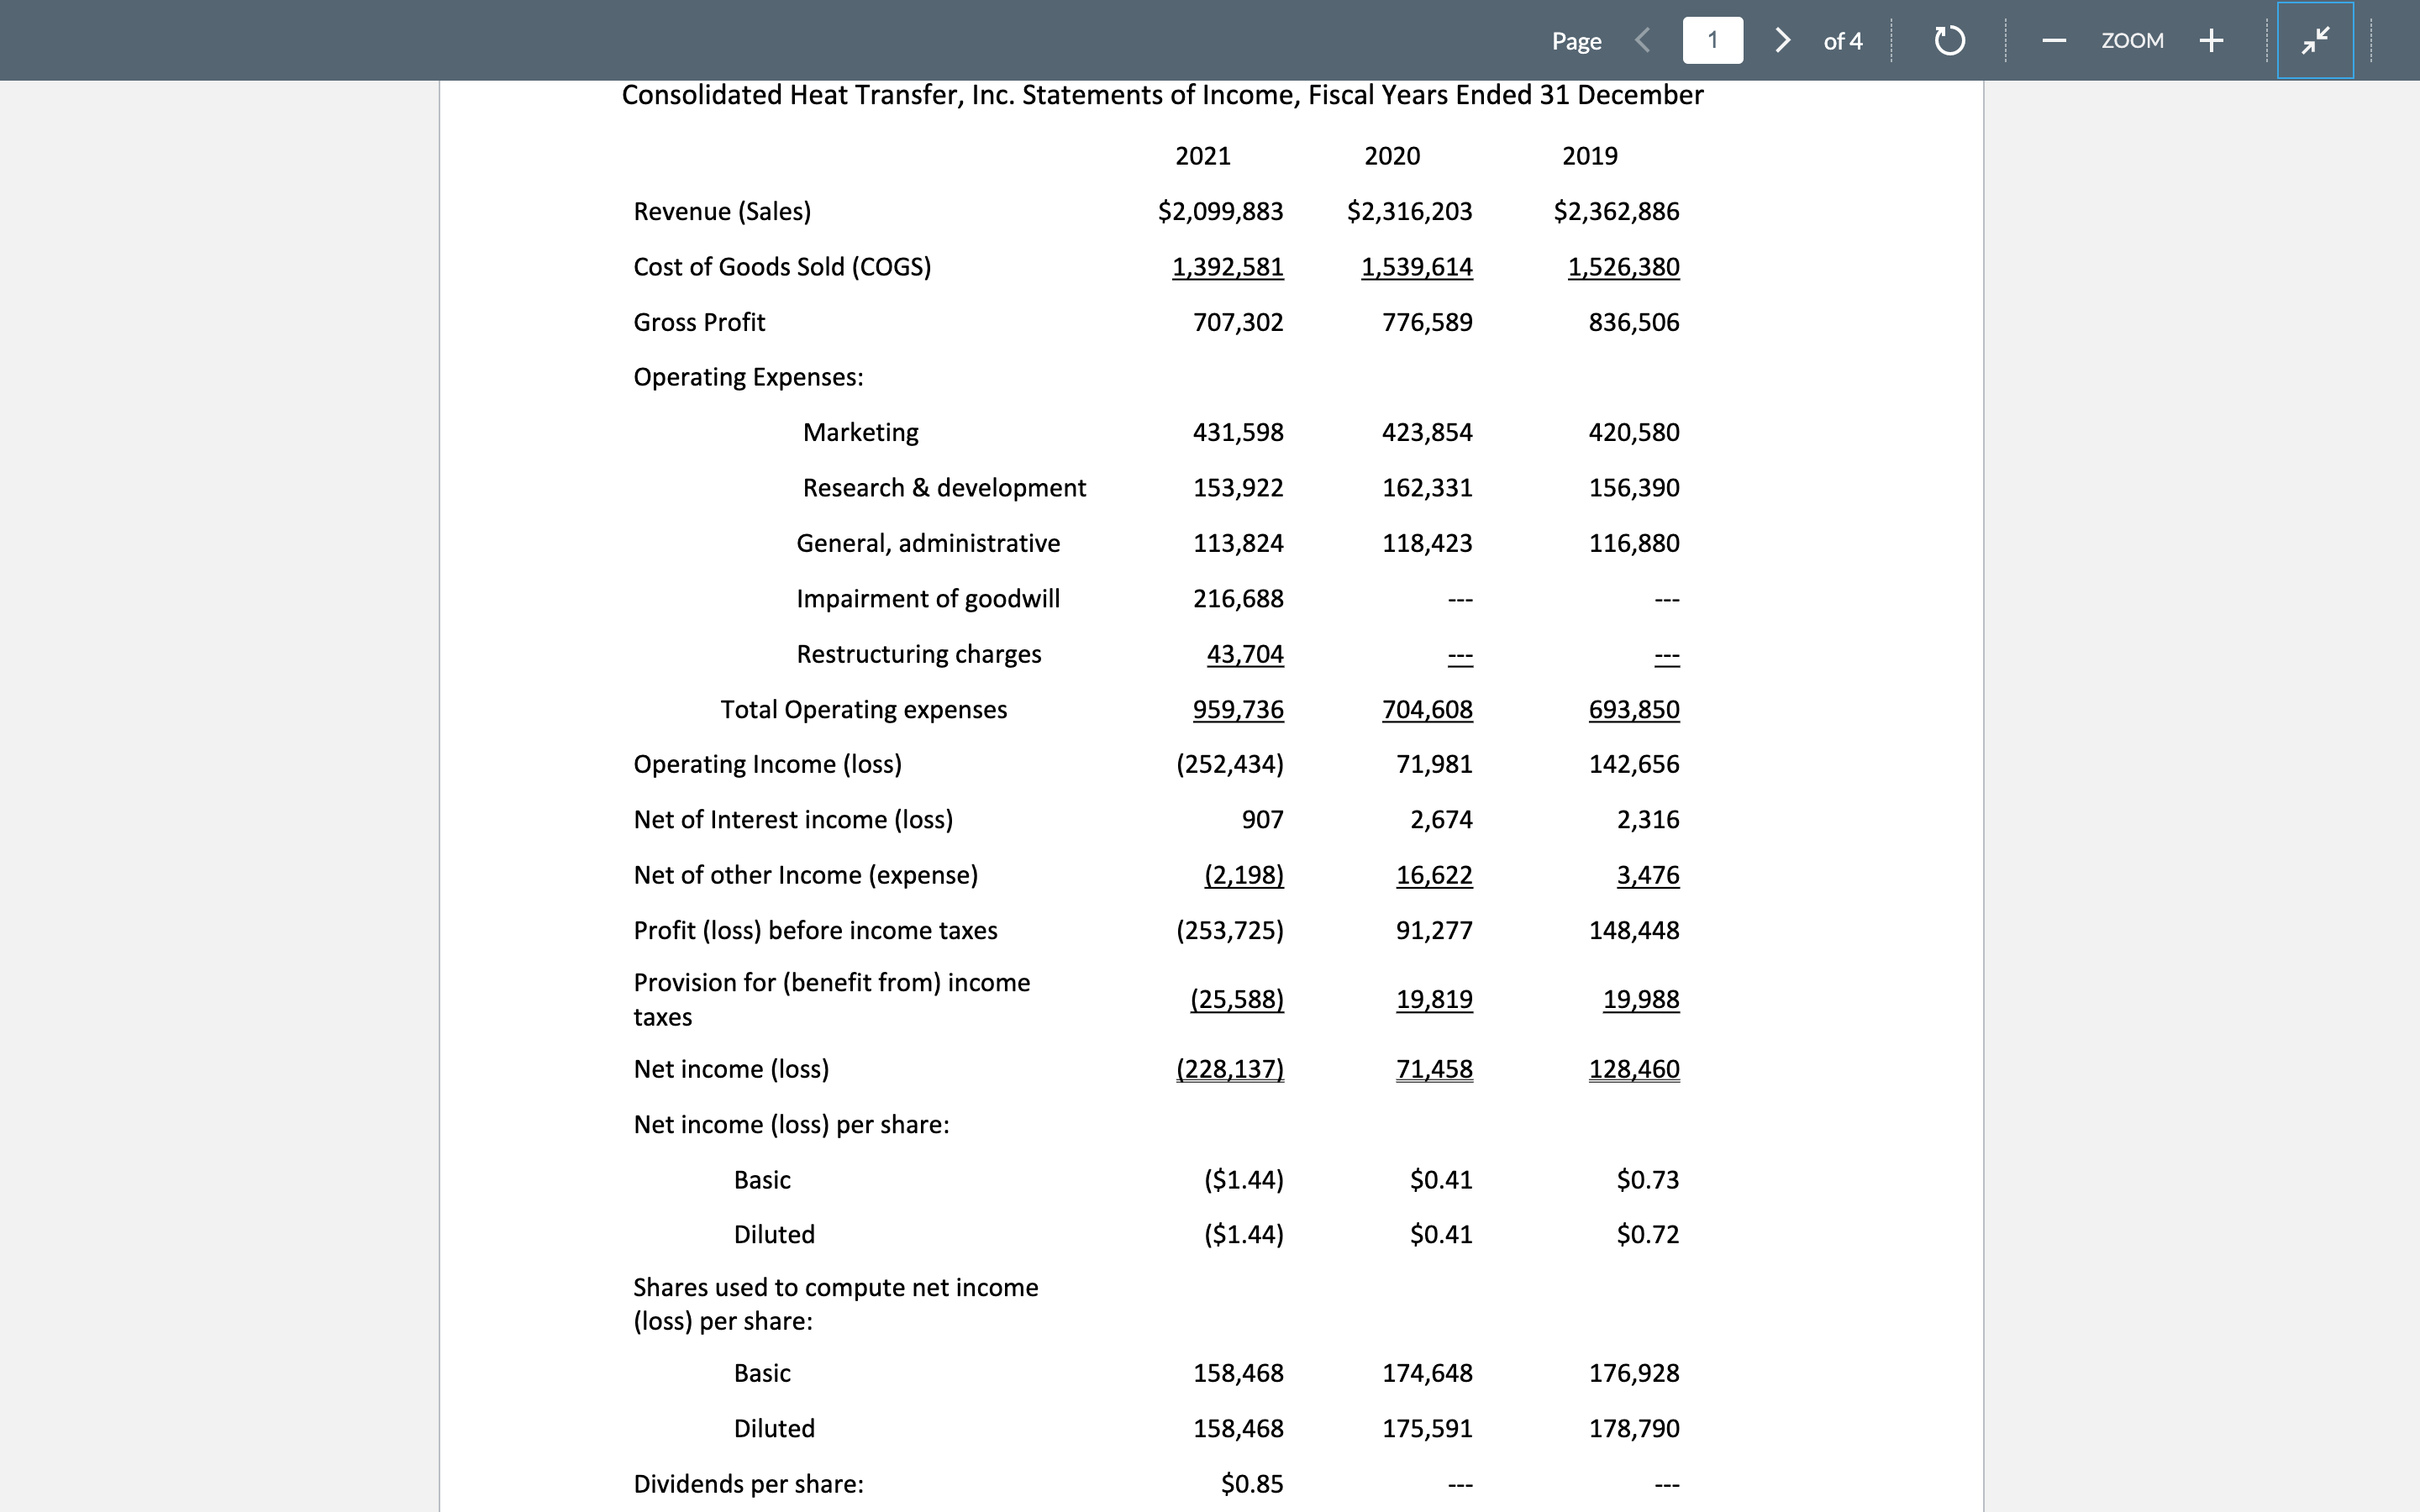
Consolidated Heat Transfer, Inc. Statements of Income, Fiscal Years Ended 31 December Net income (loss) per share: BasicDiluted($1.44)($1.44)$0.41$0.41$0.73$0.72 Shares used to compute net income (loss) per share: Basic Diluted 158,468158,468$0.85174,648175,591176,928178,790 Item 1: Business Overview CHT is a leader in heat transfer products including cooling towers for commercial buildings and heat exchangers in industries ranging from warehousing to shipbuilding. The company is based in New York, NY and operates through subsidiaries in three global regions: the Americas (North and South America), Europe, Middle East, and Africa (EMEA); and Asia Pacific (Japan, S. Korea, Australia). CHT holds patents for specialized materials and processes for various products in two business segments: - Cooling towers are sold to the construction and commercial building market. - Heat exchangers are sold to suppliers and installers of industrial motors and generators. Item 7: Management Discussion and Analysis of Financial Conditions and Results of Operations: Net Sales: Commercial cooling tower sales decreased 8% and units sold decreased by 7% in FY 2021, compared to the previous fiscal year. All three regions experienced declines in FY 2021. The overall average selling price for commercial cooling towers declined 1\% in FY 2021 compared with the prior fiscal year. Commercial cooling tower sales in FY 2020 remained flat when compared to sales in FY 2019. The commercial cooling tower increase in Asia Pacific was offset by declines in EMEA and the Americas. Commercial cooling tower units sold increased by 3% in FY 2020 compared with the prior fiscal year. The overall commercial cooling tower average selling price declined 4% in FY 2020 compared with the prior fiscal year. Cooling tower construction net sales decreased 24% and 17% and units sold decreased 12\% in FYs 2021 and 2020, compared with the preceding fiscal years. These declines were primarily due to lower sales in wood timbers construction caused by changes with a large customer, and lower sales in fiberglass construction. Heat exchanger net sales decreased 7\% in FY 2021, compared with the prior fiscal year, with declines in sales in all regions. The entire heat exchanger demand decreased in all regions, even as competition increased in FY 2021, while new product launches contributed to lower demand. Heat exchanger net sales increased by 10% in FY 2020 vs. FY 2019, especially in the EMEA and Asia Pacific regions (Russia, Japan, and Australia in particular). Gross Profit: The gross profit margin for FY 2021 was stable at 33.7%, and was 33.5% in FY 2020. Gross profit margin declined year-over-year in FY 2020 compared to FY 2019 . The Gross profit margin declined year-over-year in FY 2020 compared to FY 2019. The primary cause is attributed to higher manufacturing and distribution expenses, specifically labor and obsolescence costs. This was traced to an inventory valuation adjustment of $34.1 million showing the lower of cost or market on the inventory of cooling tower parts and materials on hand and at suppliers, and an unfavorable shift in commercial cooling tower product mix towards products with lower average selling prices. Operating Expenses: In FY 2021, total operating expenses increased as a percentage of net sales, mostly due to two items: - The goodwill impairment charge of $214.5 million in the heat exchanger segment. - $43.7 million restructuring plan expenses in FY 2021. Marketing and Selling: There were net increases in advertising, product design, consulting and marketing related to new product launches. Marketing and selling expense increased 2% in FY2021, compared to FY 2020. The increase in marketing and selling in FY 2020 versus FY 2019 was 1\%. In particular, higher personnel expenses from new hiring of the sales teams in all regions. Infrastructure costs also increased related to the higher headcount. Costs were also attributed to settlement of a customer bankruptcy lawsuit. Some offsetting occurred from a decrease in variable demand generation compared to FY 2019. There was also a decrease in accrued bonus expenses due to lower profitabilitv levels. Research and Development: FY 2021 saw a 5\% decrease in R\&D expense compared to FY 2020. Restructuring is the main cause, which resulted in a decline in personnel expenses worldwide. FY 2020 had a 4\% increase in R\&D expense over FY 2019 due to higher personnel expenses, and also from increased expenses for fan blades and fan motors in the cooling tower division. The increases were partly offset by decreases in accrued bonus expense from lower profitability levels, lower share-based compensation expense, and lower costs of consulting and outsourcing. General and Administrative: FY 2021 had a decrease in general and administrative expense of 4\% over FY 2020 due to reductions in personnel expense and share-based compensation expense from the worldwide reduction in workforce. The decrease was offset in part by the write-off of remaining lease agreements on the former main office. FY 2020 experienced a 1\% increase is general and administrative expense compared to FY 2019. There were higher personnel expenses from a net increase in personnel. The increase was partially offset by a decrease in accrued bonus expense from lower profitability levels, as well as lower share-based compensation expense due to some executive personnel attrition
Step by Step Solution
There are 3 Steps involved in it
Step: 1

Get Instant Access to Expert-Tailored Solutions
See step-by-step solutions with expert insights and AI powered tools for academic success
Step: 2

Step: 3
Ace Your Homework with AI
Get the answers you need in no time with our AI-driven, step-by-step assistance
Get Started
Finance Applications and Theory
Authors: Marcia Cornett, Troy Adair
3rd edition
1259252221, 007786168X, 9781259252228, 978-0077861681