Question
Context for questions: Remember Orchid Relief product produced by Eli Orchid from previous mini-projects. The product is designed to improve the night sleep, so the
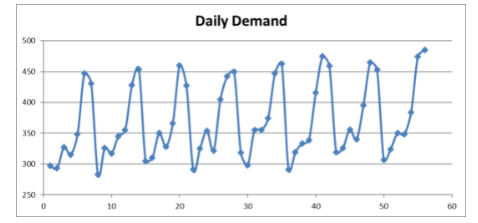
Context for questions: Remember Orchid Relief product produced by Eli Orchid from previous mini-projects. The product is designed to improve the night sleep, so the company is guessing that sales of the product is somewhat related to sleeping pattern of customers over the days of the week. Before mass production of the product, Eli Orchid has market tested Orchid Relief in only Orange County over the past 8 weeks. The weekly demand is recorded and provided below. The following graph also shows how daily demand changed over time. Eli Orchid is now trying to use the sales pattern over the past 8 weeks to predict sales in US for the upcoming few weeks, especially for days 57 and 60. An accurate forecast would be much helpful in arrangements for the company's production processes and design of price promotions over each week.
(each cycle is 7 days)
Relevant information and questions:
When the above forecast was presented to the Chief Marketing Officer, he confirmed that seasonality is present. However, he indicated that only the last week of data can be most relied on because of a special marketing campaign that was launched on day 50; the campaign is expected to be present in the near future as well. Therefore, he made the following suggestion: Make a deseasonalized forecast only based on the last 7 days of the deseasonalized time series (from day 50); then use the seasonal indexes as you did before to incorporate the effect of seasonality on this deseasonalized forecast to arrive at a seasonal forecast.
Use the deseasonalized time series for the last 7 days for questions 7 to 12 below.
a) What is a deseasonalized forecast for day 57 using the exponential smoothing method with smoothing constant 0.7 (Hint: Use deseasonalized data on day 50 as your deseasonalized forecast for day 51)?
b) What is a deseasonalized forecast for day 60 using the exponential smoothing method with smoothing constant 0.7?
c) Using the deseasonalized forecast of question 11 as the Chief Marketing Officer suggested, what is a (seasonal) forecast for day 60?
Dataset and graph:
| # of days | Daily Demand |
| 1 | 297 |
| 2 | 293 |
| 3 | 327 |
| 4 | 315 |
| 5 | 348 |
| 6 | 447 |
| 7 | 431 |
| 8 | 283 |
| 9 | 326 |
| 10 | 317 |
| 11 | 345 |
| 12 | 355 |
| 13 | 428 |
| 14 | 454 |
| 15 | 305 |
| 16 | 310 |
| 17 | 350 |
| 18 | 328 |
| 19 | 366 |
| 20 | 460 |
| 21 | 427 |
| 22 | 291 |
| 23 | 325 |
| 24 | 354 |
| 25 | 322 |
| 26 | 405 |
| 27 | 442 |
| 28 | 450 |
| 29 | 318 |
| 30 | 298 |
| 31 | 355 |
| 32 | 355 |
| 33 | 374 |
| 34 | 447 |
| 35 | 463 |
| 36 | 291 |
| 37 | 319 |
| 38 | 333 |
| 39 | 339 |
| 40 | 416 |
| 41 | 475 |
| 42 | 459 |
| 43 | 319 |
| 44 | 326 |
| 45 | 356 |
| 46 | 340 |
| 47 | 395 |
| 48 | 465 |
| 49 | 453 |
| 50 | 307 |
| 51 | 324 |
| 52 | 350 |
| 53 | 348 |
| 54 | 384 |
| 55 | 474 |
| 56 | 485 |

Step by Step Solution
There are 3 Steps involved in it
Step: 1

Get Instant Access to Expert-Tailored Solutions
See step-by-step solutions with expert insights and AI powered tools for academic success
Step: 2

Step: 3

Ace Your Homework with AI
Get the answers you need in no time with our AI-driven, step-by-step assistance
Get Started


