

Answered step by step
Verified Expert Solution
Question
1 Approved Answer
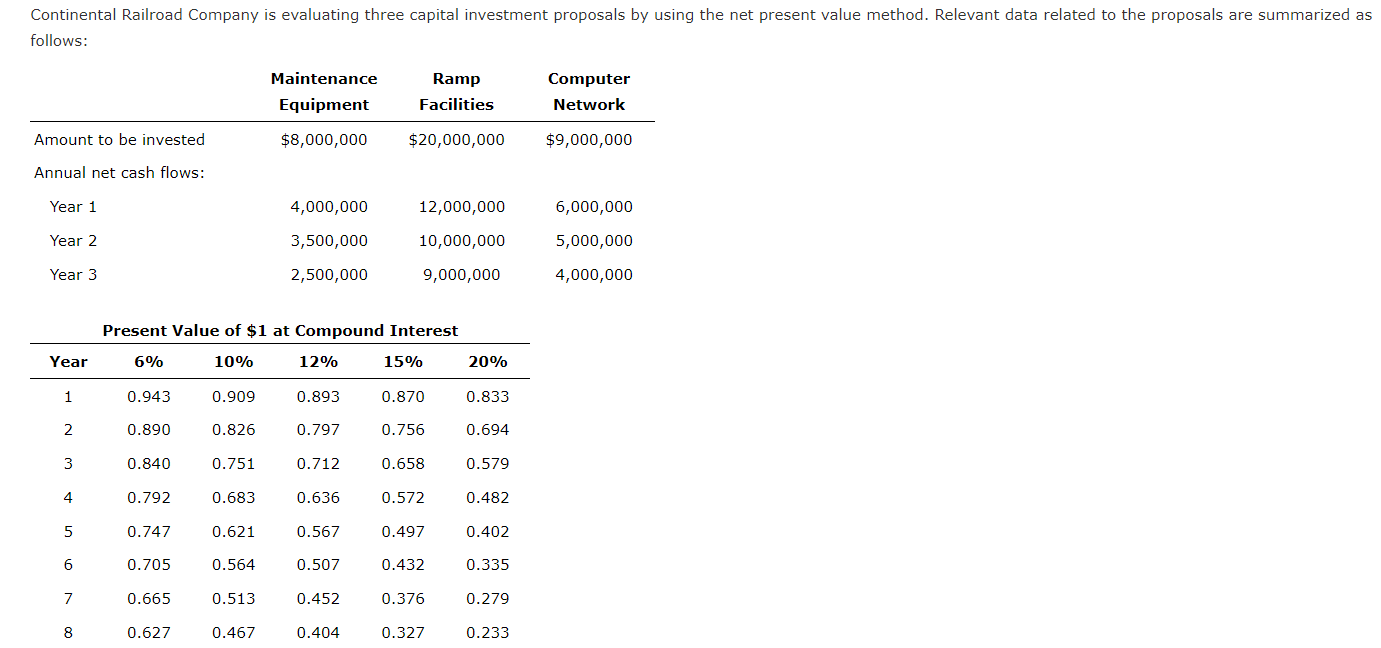
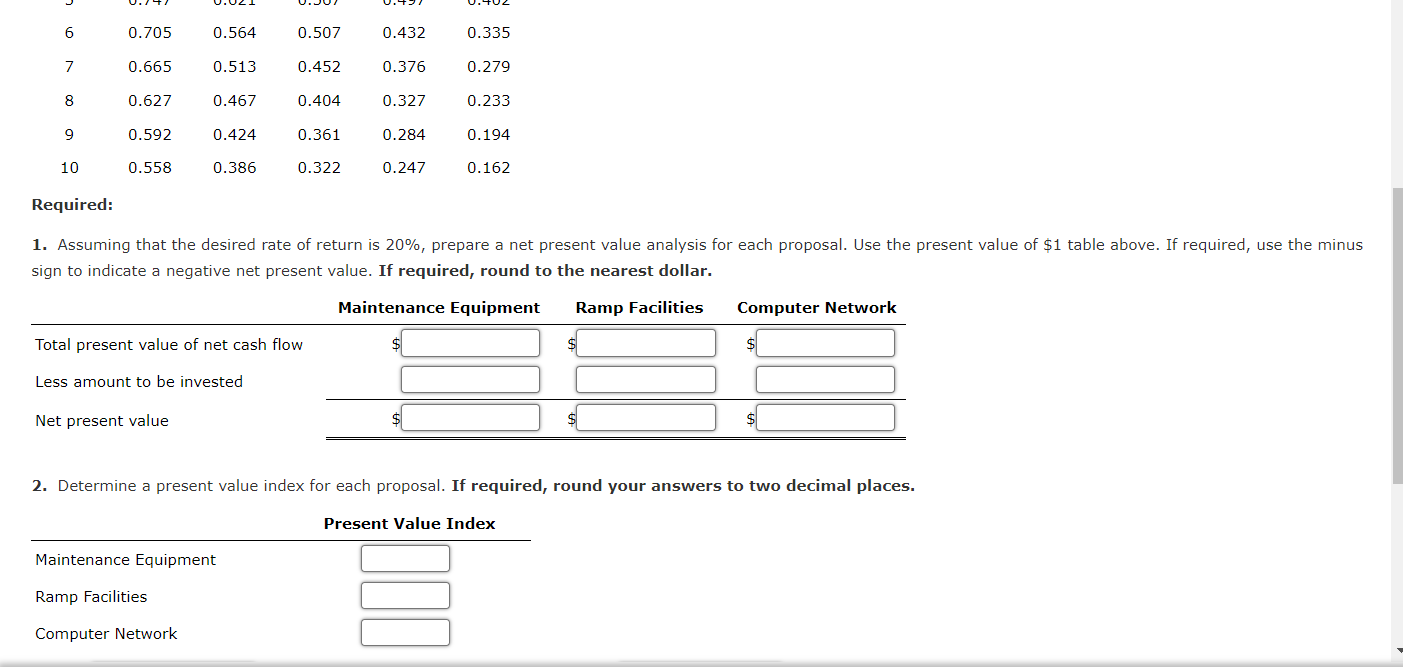
Continental Railroad Company is evaluating three capital investment proposals by using the net present value method. Relevant data related to the proposals are summarized as
Step by Step Solution
There are 3 Steps involved in it
Step: 1

Get Instant Access to Expert-Tailored Solutions
See step-by-step solutions with expert insights and AI powered tools for academic success
Step: 2

Step: 3
Ace Your Homework with AI
Get the answers you need in no time with our AI-driven, step-by-step assistance
Get Started
The Chief Value Officer Accountants Can Save The Planet
Authors: Mervyn King, Jill Atkins
1st Edition
1783532939, 978-1783532933