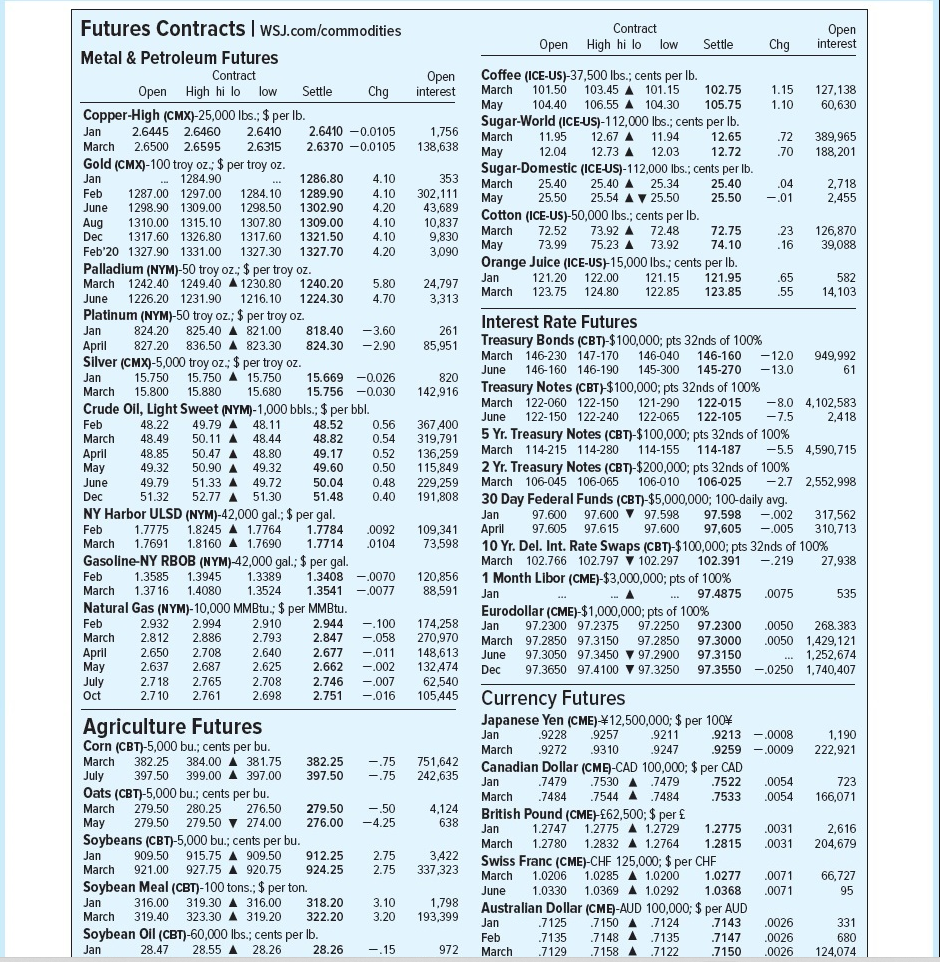
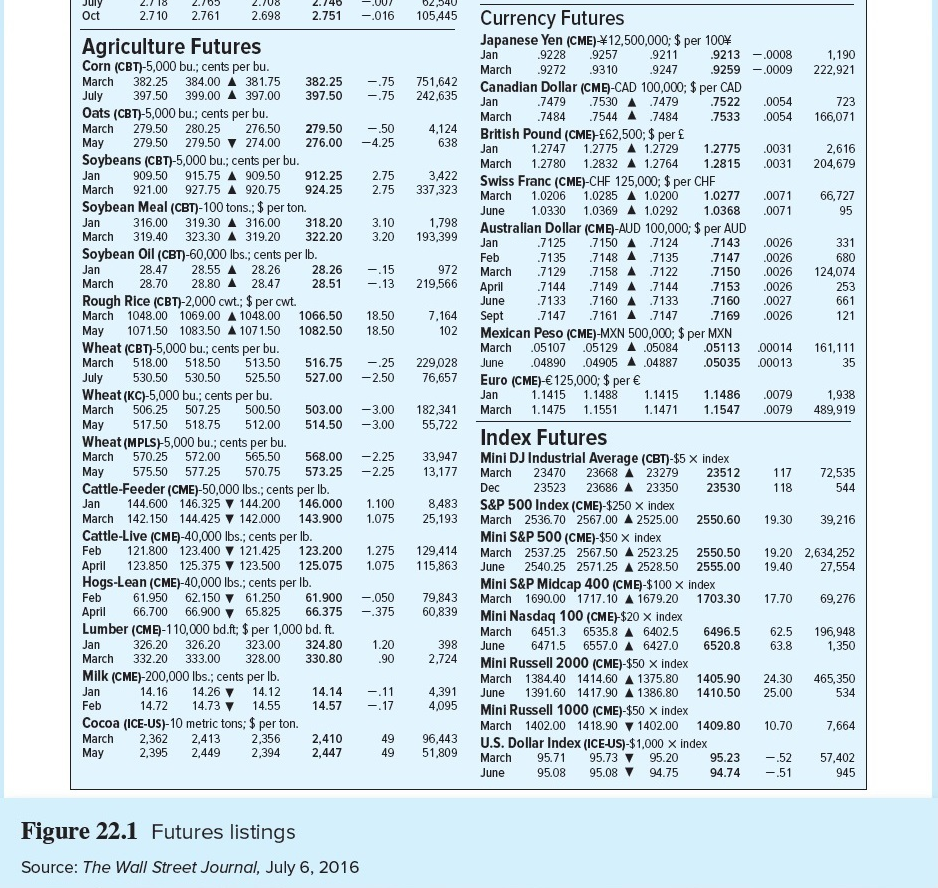
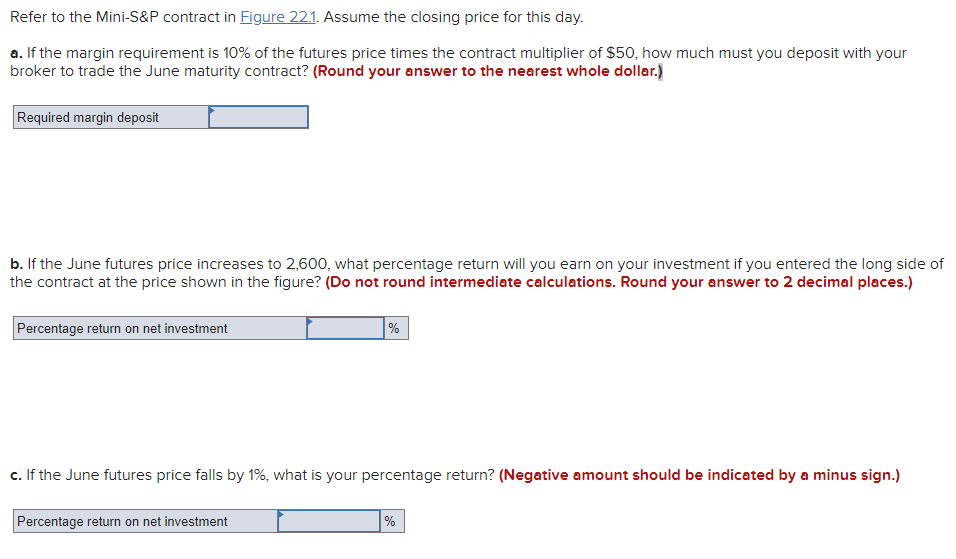
Contract Open High hilo low Open interest Settle Chg Open interest 1.15 1.10 127,138 60,630 1,756 138,638 March .72 .70 389,965 188,201 12.73 12.03 Coffee (ICE-US)-37,500 lbs., cents per lb. March 101.50 103.45 A 101.15 102.75 May 104.40 106.55 A 104.30 105.75 Sugar-World (ICE-US)-112,000 lbs., cents per lb. 11.95 12.67 A 11.94 12.65 May May 12.04 12.04 12.72 Sugar-Domestic (ICE-US)-112,000 lbs., cents per lb. 25.40 25.40 A 25.34 25.40 May 25.50 25.54 A 25.50 25.50 Cotton (ICE-US)-50,000 lbs., cents per lb. March 72.52 73.92 A 72.48 72.75 May 73.99 75.23 A 73.92 74.10 Orange Juice (ICE-USH15,000 lbs., cents per Ib. Jan 121.20 122.00 121.15 121.95 March 123.75 124.80 122.85 123.85 March .04 -.01 353 302,111 43,689 10,837 9,830 3,090 2,718 2,455 .23 .16 126,870 39,088 24,797 3,313 .65 55 582 14,103 261 85,951 Futures Contracts WSJ.com/commodities Metal & Petroleum Futures Contract Open High hilo low Settle Chg Copper-High (CMX)-25,000 lbs.; $ per lb. Jan 2.6445 2.6460 2.6410 2.6410 -0.0105 March 2.6500 2.6595 2.6315 2.6370 -0.0105 Gold (CMX)-100 troy oz. $ per troy oz. Jan 1284.90 1286.80 4.10 Feb 1287.00 1297.00 1284.10 1289.90 4.10 June 1298.90 1309.00 1298.50 1302.90 4.20 Aug 1310.00 1315.10 1307.80 1309.00 4.10 Dec 1317.60 1326.80 1317.60 1321.50 4.10 Feb'20 1327.90 1331.00 1327.30 1327.70 4.20 Palladium (NYM)-50 troy oz. $ pert er troy oz. March 1242.40 1249.40 A 1230.80 1240.20 5.80 1226.20 1231.90 1216.10 June 1224.30 4.70 20.20.01.30 Platinum (NYM)-50 troy oz.: $ per troy oz. 1 Jan 824.20 825.40 A 821.00 818.40 -3.60 April 827.20 836.50 A 823.30 824.30 -2.90 Silver (CMX)-5,000 troy oz. $ per troy oz. Jan 15.750 15.750 15.756 15.669 -0.026 March 15.880 15.680 15.756 -0.030 Crude Oil, Light Sweet (NYM)-1,000 bbls.; $ per bbl. Feb 48.22 49.79 A 48.11 48.52 0.56 March 48.49 50.11 A 48.44 48.82 0.54 April 48.85 50.47 A 48.80 49.17 0.52 May 49.32 50.90 A 49.32 49.60 0.50 June 49.79 51.33 A 49.72 50.04 0.48 Dec 51.32 52.77 A 51.30 51.48 0.40 NY Harbor ULSD (NYM)-42,000 gal.; $ per gal. Feb 1.7775 1.8245 A 1.7764 1.7784 .0092 March 1.7691 1.8160 A 1.7690 1.7714 ,0104 Gasoline-NY RBOB (NYM) 42,000 gal.; $ per gal. Feb 1.3585 1.3945 1.3389 1.3408-0070 March 1.3524 1.3541 -0077 Natural Gas (NYM)-10,000 MMBtu.; $ per MMBtu. Feb 2.932 2.994 2.910 2.944 -.100 March 2.812 2.886 2.793 -.058 April 2.650 2.640 2.677 -.011 May 2.637 2.687 2.625 2.662 -.002 July 2.718 2.765 2.708 2.746 -.007 Oct 2.710 2.761 2.698 2.751 -.016 -13.0 15.800 820 142.916 367,400 319,791 136,259 115,849 229,259 191,808 109,341 73,598 1.3716 1.4080 120,856 88,591 2.847 Interest Rate Futures Treasury Bonds (CBT)-$100,000; pts 32nds of 100% March 146-230 147-170 146-040 146-160 -12.0 949,992 June 146-160 146-190 145-300 145-270 61 Treasury Notes (CBT)$100,000; pts 32nds of 100% March 122-060 122-150 121-290 122-015 -8.0 4.102,583 June 122-150 122-240 122-065 122-105 -7.5 2,418 5 Yr. Treasury Notes (CBT)-$100,000; pts 3 32nds of 100% March 114-215 114-280 114-155 114-187 -5.5 4,590,715 2 Yr. Treasury Notes (CBT)-$200,000; pts 32nds of 100% March 106-045 106-065 106-010 106-025 -2.7 2,552,998 30 Day Federal Funds (CBT)-$5,000,000; 100-daily avg. Jan 97.600 97.600 V 97.598 97.598 -.002 317.562 April 97.605 97.615 97.600 97,605 -2005 310,713 10 Yr. Del. Int. Rate Swaps (CBT)-$100,000; pts 32nds of 100% March 102.766 102.797 102.297 102.391 -.219 27.938 Month Libor (CME)-$3,000,000; pts of 100% Jan A 97.4875 .0075 535 Eurodollar (CME)-$1,000,000; pts of 100% Jan 97.2300 97.2375 97.2250 97.2300 .0050 268.383 March 97.2850 97.3150 97.2850 97.3000 .0050 1,429,121 June 97.3050 97.3450 97.2900 97.3150 1,252,674 Dec 97.3650 97.4100 97.3250 97.3550 -.0250 1.740,407 Currency Futures Japanese Yen (CME) W12,500,000: $ per 1004 Jan .9228 .9257 .9211 .9213-0008 1,190 .9310 9247 .9259 -.0009 222.921 Canadian Dollar (CME)-CAD 100,000; $per CAD Jan .7530 A .7479 723 March .7484 .7544 .7484 .7533 .0054 166,071 British Pound (CME)62,500; $ per Jan 1.2747 1.2775 A 1.2729 1.2775 .0031 March 1.2780 1.2832 A 1.2764 1.2815 .0031 204,679 Swiss Franc (CME)-CHF 125,000; $ per CHE March 1.0206 1.0285 A 1.0200 1.0277 .0071 66,727 June 1.0330 1.0369 A 1.0292 1.0368 .0071 95 Australian Dollar (CME)-AUD 100,000: $ per AUD Jan .7125 .7150 .7124 .7143 .0026 331 Feb .7148 A .7135 .7147 .0026 680 March .7129 .7158 .7122 .7150 .0026 124,074 174,258 270,970 148,613 132,474 62,540 105,445 2.708 March .9272 .75 -.75 751,642 242,635 .7479 .7522 .0054 279.50 -.50 -4.25 4,124 638 2.616 Agriculture Futures Corn (CBT)-5,000 bu., cents per bu. March 382.25 384.00 A 381.75 382.25 July 397.50 399.00 A 397.00 397.50 Oats (CBT)-5,000 bu., cents per bu. March 279.50 280.25 276.50 279.50 279.50 274.00 276.00 Soybeans (CBT)-5,000 bu.; cents per bu. Jan 909.50 915.75 A 909.50 912.25 921.00 927.75 A 920.75 924.25 Soybean Meal (CBT)-100 tons.; $ per ton. Jan 316.00 319.30 A 316.00 318.20 March 319.40 323.30 A 319.20 322.20 Soybean Oil (CBT)-60,000 lbs., cents per lb. Jan 28.47 28.55 28.26 28.26 March 2.75 2.75 3,422 337,323 3.10 3.20 1.798 193,399 .7135 -.15 972 A 2.700 2.740 -.016 -.75 -.75 -.50 -4.25 Jan 2.75 2.75 3.10 3.20 -.15 -.13 18.50 18.50 -25 -2.50 Oct 2.710 2.761 2.698 2.751 Agriculture Futures Corn (CBT)-5,000 bu.; cents per bu. March 382.25 384.00 A 381.75 382.25 July 397.50 399.00 A 397.00 397.50 Oats (CBT)-5,000 bu.; cents per bu. March 279.50 280.25 276.50 279.50 May 279.50 279.50 V 274.00 276.00 Soybeans (CBT)-5,000 bu. cents per bu. Jan 909.50 915.75 A 909.50 912.25 March 921.00 927.75 A 920.75 924.25 Soybean Meal (CBT)-100 tons.; $ per ton. Jan 316.00 319.30 A 316.00 318.20 March 319.40 323.30 A 319.20 322.20 Soybean Oil (CBT)-60,000 lbs., cents per lb. Jan 28.47 28.55 A 28.26 28.26 March 28.70 28.80 A 28.47 28.51 Rough Rice (CBT)-2,000 cwt.; $ per cut. March 1048.00 1069.00 A 1048.00 1066.50 May 1071.50 1083.50 A 107 1.50 1082.50 Wheat (CBT)-5,000 bu.; cents per bu. March 518.00 518.50 513.50 516.75 July 530.50 530.50 525.50 527.00 Wheat (KC)-5,000 bu., cents per bu. March 506.25 507.25 500.50 503.00 May 517.50 518.75 512.00 514.50 Wheat (MPLS)-5,000 bu., cents per bu. March 570.25 572.00 565.50 568.00 May 575.50 577.25 570.75 573.25 Cattle-Feeder (CME)-50,000 lbs.; cents per lb. 144.600 146.325 V 144.200 146.000 March 142.150 144.425 V 142.000 143.900 Cattle-Live (CME)-40,000 lbs.; cents per lb. Feb 121.800 123.400 V 121.425 123.200 April 123.850 125.375 123.500 125.075 Hogs-Lean (CME)-40,000 lbs., cents per lb. Feb 61.950 62.150 61.250 61.900 April 66.700 66.900 65.825 66.375 Lumber (CME-110,000 bd.ft: $ per 1,000 bd. ft. Jan 326.20 326.20 323.00 324.80 March 332.20 333.00 328.00 330.80 Milk (CME)-200,000 lbs., cents per lb. Jan 14.16 14.26 14.12 14.14 Feb 14.72 14.73 14.55 14.57 Cocoa (ICE-US)-10 metric tons: $ per ton. March 2,362 2,413 2,356 2,410 May 2,395 2,449 2,394 2,447 2,540 105.445 Currency Futures Japanese Yen (CME) #12,500,000; $ per 1004 Jan .9228 .9257 .9211 .9213 -.0008 1,190 March .9272 .9310 .9247 .9259 -.0009 222,921 751,642 Canadian Dollar (CME-CAD 100,000; $ per CAD 242,635 Jan .7479 .7530 A .7479 .7522 .0054 723 March .7484 .7544 .7484 .7533 .0054 166,071 4,124 British Pound (CME) 62,500: $ per 638 1.2747 1.2775 A 1.2729 1.2775 .0031 2,616 March 1.2780 1.2832 A 1.2764 1.2815 .0031 204,679 3,422 Swiss Franc (CME)-CHF 125,000; $ per CHF 337,323 March 1.0206 1.0285 A 1.0200 1.0277 .0071 66,727 June 1.0330 1.0369 A 1.0292 1.0368 .0071 95 1,798 193,399 Australian Dollar (CME-AUD 100,000: $ per AUD Jan .7125 .7150 A .7124 .7143 .0026 331 Feb .7135 .7148 A .7135 .7147 .0026 680 972 March .7129 .7158 A 7122 .7150 .0026 124,074 219,566 April .7144 .7149 A 7144 .7153 .0026 253 June .7133 .7160 A .7133 .7160 .0027 661 7,164 Sept .7147 .7161 A 7147 .7169 .0026 121 102 Mexican Peso (CME)-MXN 500,000: $ per MXN March .05107 .05129 A.05084 .05113 .00014 161,111 229,028 June .04890 .04905 A .04887 .05035 .00013 35 76,657 Euro (CME)- 125,000; $ per Jan 1.1415 1.1488 1.1415 1.1486 .0079 1,938 182,341 March 1.1475 1.1551 1.1471 1.1547 .0079 489,919 55,722 Index Futures 33,947 Mini DJ Industrial Average (CBT)-$5 X index 13,177 March 23470 23668 A 23279 23512 117 72,535 23523 23686 A 23350 23530 118 544 8,483 S&P 500 Index (CME)-$250 X index 25,193 March 2536.70 2567.00 A 2525.00 2550.60 19.30 39,216 Mini S&P 500 (CME)-$50 X index 129,414 March 2537.25 2567.50 A 2523.25 2550.50 19.20 2,634,252 115,863 June 2540.25 2571.25 A 2528.50 2555.00 19.40 27,554 Mini S&P Midcap 400 (CME)-$100 x index 79,843 March 1690.00 1717.10 A 1679.20 1703.30 17.70 69,276 60,839 Mini Nasdaq 100 (CME) $20 x index March 6451.3 6535.8 A 6402.5 6496.5 62.5 196,948 398 June 6471.5 6557.0 6427.0 6520.8 63.8 1,350 2,724 Mini Russell 2000 (CME)-$50 X index March 1384.40 1414.60 A 1375.80 1405.90 24.30 465,350 4,391 June 1391.60 1417.90 A 1386.80 1410.50 25.00 534 4,095 Mini Russell 1000 (CME)-$50 X index March 1402.00 1418.90 1402.00 1409.80 10.70 7,664 96,443 U.S. Dollar Index (ICE-US)-$1,000 x index 51,809 March 95.71 95.737 95.20 95.23 -.52 57,402 June 95.08 95.08 V 94.75 94.74 -.51 945 -3.00 -3.00 -2.25 -2.25 Dec Jan 1.100 1.075 1.275 1.075 -.050 -.375 1.20 .90 -.11 -.17 49 49 Figure 22.1 Futures listings Source: The Wall Street Journal, July 6, 2016 Refer to the Mini-S&P contract in Figure 22.1. Assume the closing price for this day. a. If the margin requirement is 10% of the futures price times the contract multiplier of $50, how much must you deposit with your broker to trade the June maturity contract? (Round your answer to the nearest whole dollar.) Required margin deposit b. If the June futures price increases to 2,600, what percentage return will you earn on your investment if you entered the long side of the contract at the price shown in the figure? (Do not round intermediate calculations. Round your answer to 2 decimal places.) Percentage return on net investment % c. If the June futures price falls by 1%, what is your percentage return? (Negative amount should be indicated by a minus sign.) Percentage return on net investment % Contract Open High hilo low Open interest Settle Chg Open interest 1.15 1.10 127,138 60,630 1,756 138,638 March .72 .70 389,965 188,201 12.73 12.03 Coffee (ICE-US)-37,500 lbs., cents per lb. March 101.50 103.45 A 101.15 102.75 May 104.40 106.55 A 104.30 105.75 Sugar-World (ICE-US)-112,000 lbs., cents per lb. 11.95 12.67 A 11.94 12.65 May May 12.04 12.04 12.72 Sugar-Domestic (ICE-US)-112,000 lbs., cents per lb. 25.40 25.40 A 25.34 25.40 May 25.50 25.54 A 25.50 25.50 Cotton (ICE-US)-50,000 lbs., cents per lb. March 72.52 73.92 A 72.48 72.75 May 73.99 75.23 A 73.92 74.10 Orange Juice (ICE-USH15,000 lbs., cents per Ib. Jan 121.20 122.00 121.15 121.95 March 123.75 124.80 122.85 123.85 March .04 -.01 353 302,111 43,689 10,837 9,830 3,090 2,718 2,455 .23 .16 126,870 39,088 24,797 3,313 .65 55 582 14,103 261 85,951 Futures Contracts WSJ.com/commodities Metal & Petroleum Futures Contract Open High hilo low Settle Chg Copper-High (CMX)-25,000 lbs.; $ per lb. Jan 2.6445 2.6460 2.6410 2.6410 -0.0105 March 2.6500 2.6595 2.6315 2.6370 -0.0105 Gold (CMX)-100 troy oz. $ per troy oz. Jan 1284.90 1286.80 4.10 Feb 1287.00 1297.00 1284.10 1289.90 4.10 June 1298.90 1309.00 1298.50 1302.90 4.20 Aug 1310.00 1315.10 1307.80 1309.00 4.10 Dec 1317.60 1326.80 1317.60 1321.50 4.10 Feb'20 1327.90 1331.00 1327.30 1327.70 4.20 Palladium (NYM)-50 troy oz. $ pert er troy oz. March 1242.40 1249.40 A 1230.80 1240.20 5.80 1226.20 1231.90 1216.10 June 1224.30 4.70 20.20.01.30 Platinum (NYM)-50 troy oz.: $ per troy oz. 1 Jan 824.20 825.40 A 821.00 818.40 -3.60 April 827.20 836.50 A 823.30 824.30 -2.90 Silver (CMX)-5,000 troy oz. $ per troy oz. Jan 15.750 15.750 15.756 15.669 -0.026 March 15.880 15.680 15.756 -0.030 Crude Oil, Light Sweet (NYM)-1,000 bbls.; $ per bbl. Feb 48.22 49.79 A 48.11 48.52 0.56 March 48.49 50.11 A 48.44 48.82 0.54 April 48.85 50.47 A 48.80 49.17 0.52 May 49.32 50.90 A 49.32 49.60 0.50 June 49.79 51.33 A 49.72 50.04 0.48 Dec 51.32 52.77 A 51.30 51.48 0.40 NY Harbor ULSD (NYM)-42,000 gal.; $ per gal. Feb 1.7775 1.8245 A 1.7764 1.7784 .0092 March 1.7691 1.8160 A 1.7690 1.7714 ,0104 Gasoline-NY RBOB (NYM) 42,000 gal.; $ per gal. Feb 1.3585 1.3945 1.3389 1.3408-0070 March 1.3524 1.3541 -0077 Natural Gas (NYM)-10,000 MMBtu.; $ per MMBtu. Feb 2.932 2.994 2.910 2.944 -.100 March 2.812 2.886 2.793 -.058 April 2.650 2.640 2.677 -.011 May 2.637 2.687 2.625 2.662 -.002 July 2.718 2.765 2.708 2.746 -.007 Oct 2.710 2.761 2.698 2.751 -.016 -13.0 15.800 820 142.916 367,400 319,791 136,259 115,849 229,259 191,808 109,341 73,598 1.3716 1.4080 120,856 88,591 2.847 Interest Rate Futures Treasury Bonds (CBT)-$100,000; pts 32nds of 100% March 146-230 147-170 146-040 146-160 -12.0 949,992 June 146-160 146-190 145-300 145-270 61 Treasury Notes (CBT)$100,000; pts 32nds of 100% March 122-060 122-150 121-290 122-015 -8.0 4.102,583 June 122-150 122-240 122-065 122-105 -7.5 2,418 5 Yr. Treasury Notes (CBT)-$100,000; pts 3 32nds of 100% March 114-215 114-280 114-155 114-187 -5.5 4,590,715 2 Yr. Treasury Notes (CBT)-$200,000; pts 32nds of 100% March 106-045 106-065 106-010 106-025 -2.7 2,552,998 30 Day Federal Funds (CBT)-$5,000,000; 100-daily avg. Jan 97.600 97.600 V 97.598 97.598 -.002 317.562 April 97.605 97.615 97.600 97,605 -2005 310,713 10 Yr. Del. Int. Rate Swaps (CBT)-$100,000; pts 32nds of 100% March 102.766 102.797 102.297 102.391 -.219 27.938 Month Libor (CME)-$3,000,000; pts of 100% Jan A 97.4875 .0075 535 Eurodollar (CME)-$1,000,000; pts of 100% Jan 97.2300 97.2375 97.2250 97.2300 .0050 268.383 March 97.2850 97.3150 97.2850 97.3000 .0050 1,429,121 June 97.3050 97.3450 97.2900 97.3150 1,252,674 Dec 97.3650 97.4100 97.3250 97.3550 -.0250 1.740,407 Currency Futures Japanese Yen (CME) W12,500,000: $ per 1004 Jan .9228 .9257 .9211 .9213-0008 1,190 .9310 9247 .9259 -.0009 222.921 Canadian Dollar (CME)-CAD 100,000; $per CAD Jan .7530 A .7479 723 March .7484 .7544 .7484 .7533 .0054 166,071 British Pound (CME)62,500; $ per Jan 1.2747 1.2775 A 1.2729 1.2775 .0031 March 1.2780 1.2832 A 1.2764 1.2815 .0031 204,679 Swiss Franc (CME)-CHF 125,000; $ per CHE March 1.0206 1.0285 A 1.0200 1.0277 .0071 66,727 June 1.0330 1.0369 A 1.0292 1.0368 .0071 95 Australian Dollar (CME)-AUD 100,000: $ per AUD Jan .7125 .7150 .7124 .7143 .0026 331 Feb .7148 A .7135 .7147 .0026 680 March .7129 .7158 .7122 .7150 .0026 124,074 174,258 270,970 148,613 132,474 62,540 105,445 2.708 March .9272 .75 -.75 751,642 242,635 .7479 .7522 .0054 279.50 -.50 -4.25 4,124 638 2.616 Agriculture Futures Corn (CBT)-5,000 bu., cents per bu. March 382.25 384.00 A 381.75 382.25 July 397.50 399.00 A 397.00 397.50 Oats (CBT)-5,000 bu., cents per bu. March 279.50 280.25 276.50 279.50 279.50 274.00 276.00 Soybeans (CBT)-5,000 bu.; cents per bu. Jan 909.50 915.75 A 909.50 912.25 921.00 927.75 A 920.75 924.25 Soybean Meal (CBT)-100 tons.; $ per ton. Jan 316.00 319.30 A 316.00 318.20 March 319.40 323.30 A 319.20 322.20 Soybean Oil (CBT)-60,000 lbs., cents per lb. Jan 28.47 28.55 28.26 28.26 March 2.75 2.75 3,422 337,323 3.10 3.20 1.798 193,399 .7135 -.15 972 A 2.700 2.740 -.016 -.75 -.75 -.50 -4.25 Jan 2.75 2.75 3.10 3.20 -.15 -.13 18.50 18.50 -25 -2.50 Oct 2.710 2.761 2.698 2.751 Agriculture Futures Corn (CBT)-5,000 bu.; cents per bu. March 382.25 384.00 A 381.75 382.25 July 397.50 399.00 A 397.00 397.50 Oats (CBT)-5,000 bu.; cents per bu. March 279.50 280.25 276.50 279.50 May 279.50 279.50 V 274.00 276.00 Soybeans (CBT)-5,000 bu. cents per bu. Jan 909.50 915.75 A 909.50 912.25 March 921.00 927.75 A 920.75 924.25 Soybean Meal (CBT)-100 tons.; $ per ton. Jan 316.00 319.30 A 316.00 318.20 March 319.40 323.30 A 319.20 322.20 Soybean Oil (CBT)-60,000 lbs., cents per lb. Jan 28.47 28.55 A 28.26 28.26 March 28.70 28.80 A 28.47 28.51 Rough Rice (CBT)-2,000 cwt.; $ per cut. March 1048.00 1069.00 A 1048.00 1066.50 May 1071.50 1083.50 A 107 1.50 1082.50 Wheat (CBT)-5,000 bu.; cents per bu. March 518.00 518.50 513.50 516.75 July 530.50 530.50 525.50 527.00 Wheat (KC)-5,000 bu., cents per bu. March 506.25 507.25 500.50 503.00 May 517.50 518.75 512.00 514.50 Wheat (MPLS)-5,000 bu., cents per bu. March 570.25 572.00 565.50 568.00 May 575.50 577.25 570.75 573.25 Cattle-Feeder (CME)-50,000 lbs.; cents per lb. 144.600 146.325 V 144.200 146.000 March 142.150 144.425 V 142.000 143.900 Cattle-Live (CME)-40,000 lbs.; cents per lb. Feb 121.800 123.400 V 121.425 123.200 April 123.850 125.375 123.500 125.075 Hogs-Lean (CME)-40,000 lbs., cents per lb. Feb 61.950 62.150 61.250 61.900 April 66.700 66.900 65.825 66.375 Lumber (CME-110,000 bd.ft: $ per 1,000 bd. ft. Jan 326.20 326.20 323.00 324.80 March 332.20 333.00 328.00 330.80 Milk (CME)-200,000 lbs., cents per lb. Jan 14.16 14.26 14.12 14.14 Feb 14.72 14.73 14.55 14.57 Cocoa (ICE-US)-10 metric tons: $ per ton. March 2,362 2,413 2,356 2,410 May 2,395 2,449 2,394 2,447 2,540 105.445 Currency Futures Japanese Yen (CME) #12,500,000; $ per 1004 Jan .9228 .9257 .9211 .9213 -.0008 1,190 March .9272 .9310 .9247 .9259 -.0009 222,921 751,642 Canadian Dollar (CME-CAD 100,000; $ per CAD 242,635 Jan .7479 .7530 A .7479 .7522 .0054 723 March .7484 .7544 .7484 .7533 .0054 166,071 4,124 British Pound (CME) 62,500: $ per 638 1.2747 1.2775 A 1.2729 1.2775 .0031 2,616 March 1.2780 1.2832 A 1.2764 1.2815 .0031 204,679 3,422 Swiss Franc (CME)-CHF 125,000; $ per CHF 337,323 March 1.0206 1.0285 A 1.0200 1.0277 .0071 66,727 June 1.0330 1.0369 A 1.0292 1.0368 .0071 95 1,798 193,399 Australian Dollar (CME-AUD 100,000: $ per AUD Jan .7125 .7150 A .7124 .7143 .0026 331 Feb .7135 .7148 A .7135 .7147 .0026 680 972 March .7129 .7158 A 7122 .7150 .0026 124,074 219,566 April .7144 .7149 A 7144 .7153 .0026 253 June .7133 .7160 A .7133 .7160 .0027 661 7,164 Sept .7147 .7161 A 7147 .7169 .0026 121 102 Mexican Peso (CME)-MXN 500,000: $ per MXN March .05107 .05129 A.05084 .05113 .00014 161,111 229,028 June .04890 .04905 A .04887 .05035 .00013 35 76,657 Euro (CME)- 125,000; $ per Jan 1.1415 1.1488 1.1415 1.1486 .0079 1,938 182,341 March 1.1475 1.1551 1.1471 1.1547 .0079 489,919 55,722 Index Futures 33,947 Mini DJ Industrial Average (CBT)-$5 X index 13,177 March 23470 23668 A 23279 23512 117 72,535 23523 23686 A 23350 23530 118 544 8,483 S&P 500 Index (CME)-$250 X index 25,193 March 2536.70 2567.00 A 2525.00 2550.60 19.30 39,216 Mini S&P 500 (CME)-$50 X index 129,414 March 2537.25 2567.50 A 2523.25 2550.50 19.20 2,634,252 115,863 June 2540.25 2571.25 A 2528.50 2555.00 19.40 27,554 Mini S&P Midcap 400 (CME)-$100 x index 79,843 March 1690.00 1717.10 A 1679.20 1703.30 17.70 69,276 60,839 Mini Nasdaq 100 (CME) $20 x index March 6451.3 6535.8 A 6402.5 6496.5 62.5 196,948 398 June 6471.5 6557.0 6427.0 6520.8 63.8 1,350 2,724 Mini Russell 2000 (CME)-$50 X index March 1384.40 1414.60 A 1375.80 1405.90 24.30 465,350 4,391 June 1391.60 1417.90 A 1386.80 1410.50 25.00 534 4,095 Mini Russell 1000 (CME)-$50 X index March 1402.00 1418.90 1402.00 1409.80 10.70 7,664 96,443 U.S. Dollar Index (ICE-US)-$1,000 x index 51,809 March 95.71 95.737 95.20 95.23 -.52 57,402 June 95.08 95.08 V 94.75 94.74 -.51 945 -3.00 -3.00 -2.25 -2.25 Dec Jan 1.100 1.075 1.275 1.075 -.050 -.375 1.20 .90 -.11 -.17 49 49 Figure 22.1 Futures listings Source: The Wall Street Journal, July 6, 2016 Refer to the Mini-S&P contract in Figure 22.1. Assume the closing price for this day. a. If the margin requirement is 10% of the futures price times the contract multiplier of $50, how much must you deposit with your broker to trade the June maturity contract? (Round your answer to the nearest whole dollar.) Required margin deposit b. If the June futures price increases to 2,600, what percentage return will you earn on your investment if you entered the long side of the contract at the price shown in the figure? (Do not round intermediate calculations. Round your answer to 2 decimal places.) Percentage return on net investment % c. If the June futures price falls by 1%, what is your percentage return? (Negative amount should be indicated by a minus sign.) Percentage return on net investment %