

Answered step by step
Verified Expert Solution
Question
1 Approved Answer
Contribution margin and Income from operations? Required information [The following information applies to the questions displayed below.] Phoenix Company's 2019 master budget included the following
Contribution margin and Income from operations? 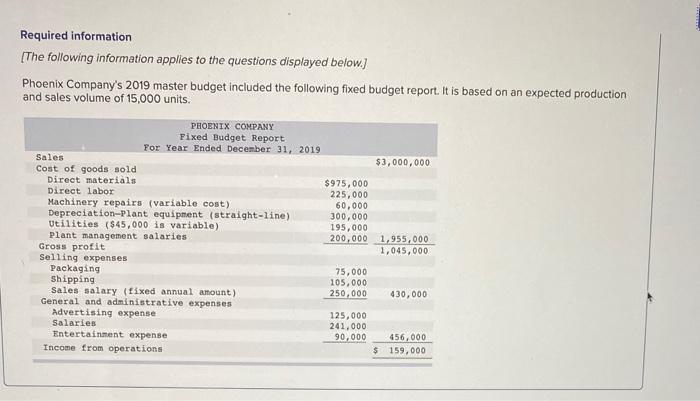
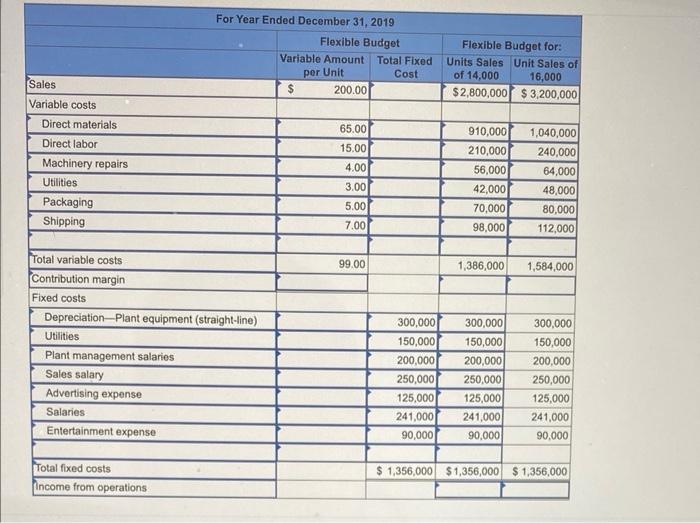
Required information [The following information applies to the questions displayed below.] Phoenix Company's 2019 master budget included the following fixed budget report. It is based on an expected production and sales volume of 15,000 units. PHOENIX COMPANY Fixed Budget Report For Year Ended December 31, 2019 Sales Cost of goods sold Direct materials Direct labor Machinery repairs (variable cost) Depreciation-Plant equipment (straight-line) Utilities ($45,000 is variable) Plant management salaries Gross profit Selling expenses Packaging Shipping Sales salary (fixed annual amount) General and administrative expenses Advertising expense Salaries Entertainment expense Income from operations $975,000 225,000 60,000 300,000 195,000 200,000 75,000 105,000 250,000 125,000 241,000 90,000 $3,000,000 1,955,000 1,045,000 430,000 456,000 $ 159,000 Sales Variable costs Direct materials Direct labor Machinery repairs Utilities Packaging Shipping Total variable costs Contribution margin Fixed costs Depreciation Plant equipment (straight-line) Utilities Plant management salaries Sales salary Advertising expense Salaries Entertainment expense For Year Ended December 31, 2019 Flexible Budget Total fixed costs Income from operations Variable Amount Total Fixed per Unit Cost $ 200.00 65.00 15.00 4.00 3.00 5.00 7.00 99.00 Flexible Budget for: Units Sales Unit Sales of of 14,000 16,000 $2,800,000 $3,200,000 910,000 1,040,000 210,000 240,000 56,000 42,000 70,000 98,000 64,000 48,000 80,000 112,000 1,386,000 1,584,000 300,000 300,000 150,000 150,000 200,000 200,000 250,000 250,000 125,000 125,000 241,000 241,000 90,000 90,000 300,000 150,000 200,000 250,000 125,000 241,000 90,000 $1,356,000 $1,356,000 $1,356,000 Step by Step Solution
There are 3 Steps involved in it
Step: 1

Get Instant Access to Expert-Tailored Solutions
See step-by-step solutions with expert insights and AI powered tools for academic success
Step: 2

Step: 3
Ace Your Homework with AI
Get the answers you need in no time with our AI-driven, step-by-step assistance
Get Started
Statistical Analysis Microsoft Excel 2013
Authors: Conrad Carlberg
1st Edition
0789753111, 9780789753113