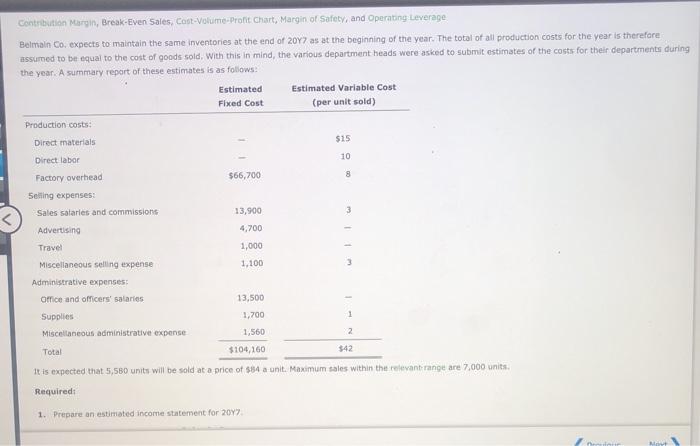
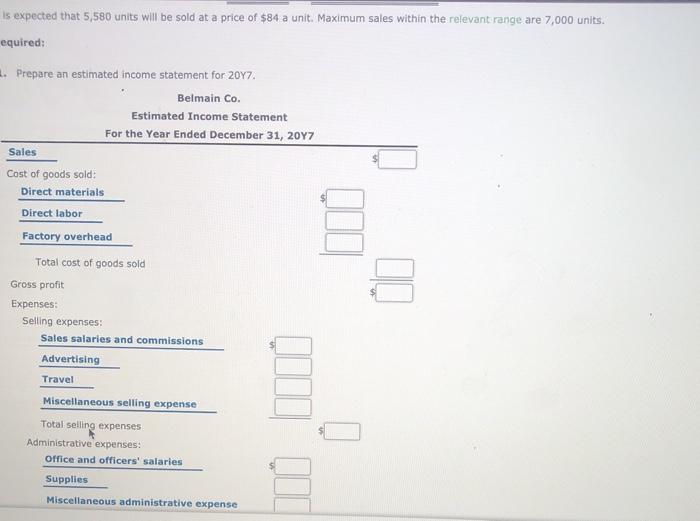
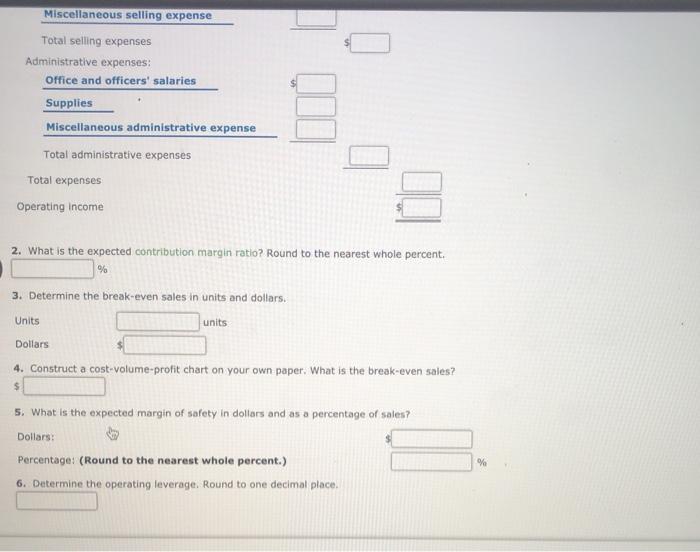
Contribution Margin, Break-even Sales Cost Volume-Profit Chart, Margin of Safety, and Operating Leverage Belmain Co. expects to maintain the same inventories at the end of 2017 as at the beginning of the year. The total of all production costs for the year is therefore assumed to be equal to the cost of goods sold. With this in mind, the various department heads were asked to submit estimates of the costs for their departments during the year. A summary report of these estimates is as follows: Estimated Estimated Variable Cost Fixed Cost (per unit sold) Production costs: Direct materials $15 Direct labor 10 Factory overhead $66,700 8 Selling expenses: Sales salaries and commissions 13,900 3 Advertising 4,700 1,000 Miscellaneous selling expense 1,100 Administrative expenses amice and officers' salaries 13,500 Supplies 1,700 1 Miscellaneous administrative expense 1,560 Total $104,160 $42 It is expected that 5,530 units will be sold at a price of $4 a unit. Maximum sales within the relevant range are 7,000 units Required: Travel 1. Prepare an estimated income statement for 2017 is expected that 5,580 units will be sold at a price of $84 a unit. Maximum sales within the relevant range are 7,000 units. equired: . Prepare an estimated income statement for 2017, Belmain Co. Estimated Income Statement For the Year Ended December 31, 2017 Sales Cost of goods sold: Direct materials Direct labor Factory overhead Total cost of goods sold Gross profit Expenses: Selling expenses: Sales salaries and commissions Advertising Travel Miscellaneous selling expense Total selling expenses Administrative expenses: Office and officers' salaries Supplies Miscellaneous administrative expense Miscellaneous selling expense Total selling expenses Administrative expenses: Office and officers' salaries Supplies Miscellaneous administrative expense Total administrative expenses Total expenses Operating income 2. What is the expected contribution margin ratio? Round to the nearest whole percent. % 3. Determine the break-even sales in units and dollars. Units units Dollars 4. Construct a cost-volume-profit chart on your own paper. What is the break-even sales? $ 5. What is the expected margin of safety in dollars and as a percentage of sales? Dollars % Percentage: (Round to the nearest whole percent.) 6. Determine the operating leverage Round to one decimal place