

Answered step by step
Verified Expert Solution
Question
1 Approved Answer
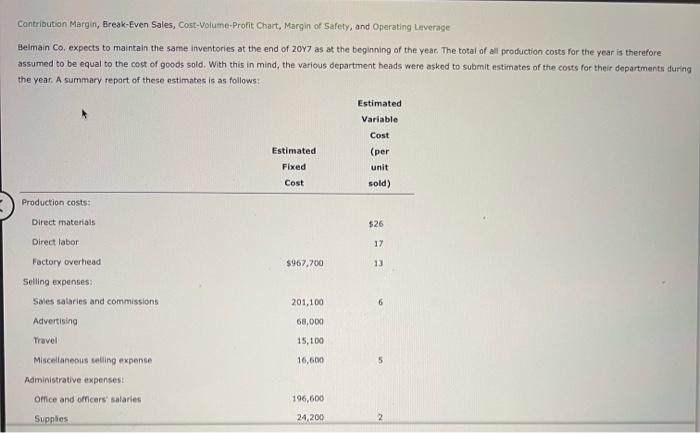
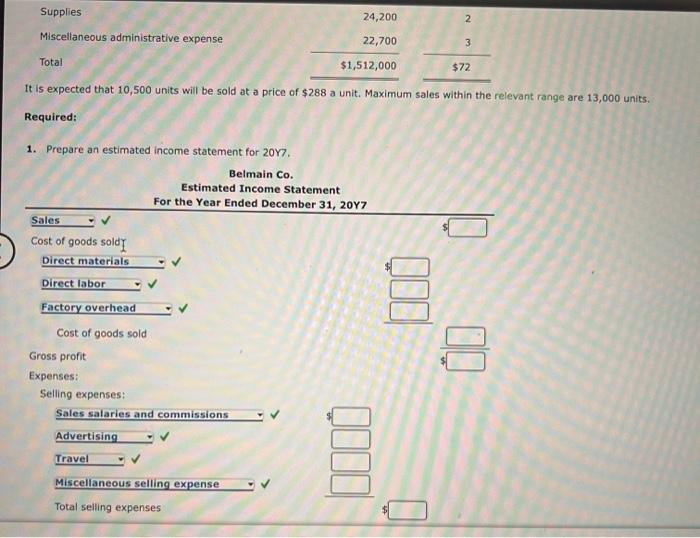
Contribution Margin, Break-Even Sales, Cost-Volume-Profit Chart, Margin of Safety, and Operating Leverage Belmain Co. expects to maintain the same inventories at the end of 2017
Step by Step Solution
There are 3 Steps involved in it
Step: 1

Get Instant Access to Expert-Tailored Solutions
See step-by-step solutions with expert insights and AI powered tools for academic success
Step: 2

Step: 3
Ace Your Homework with AI
Get the answers you need in no time with our AI-driven, step-by-step assistance
Get Started
A New Auditors Guide To Planning Performing And Presenting IT Audits
Authors: Nelson Gibb, CIA, CISA, CISSP, Divakar Jain, CA, CPA, Amitesh Joshi, Surekha Muddamsetti, Sarabjot Singh
1st Edition
0894136852, 978-0894136856