Answered step by step
Verified Expert Solution
Question
1 Approved Answer
Control $11 mathrm{mits}$ for $mathrm{X}$-bar and $mathrm{R}$ are to be set up for a process which is table $6.9$ known to have a standard deviation
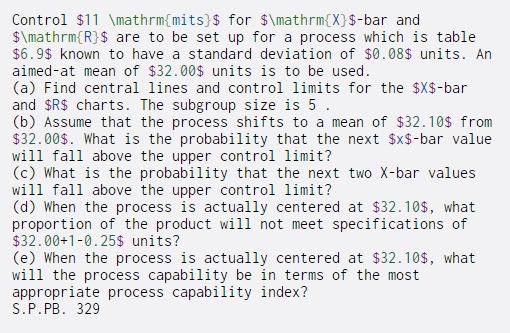
Control $11 \mathrm{mits}$ for $\mathrm{X}$-bar and $\mathrm{R}$ are to be set up for a process which is table $6.9$ known to have a standard deviation of $0.08$ units. An aimed-at mean of $32.00$ units is to be used. (a) Find central lines and control limits for the $X$-bar and $R$ charts. The subgroup size is 5. (b) Assume that the process shifts to a mean of $32.10$ from $32.00$. What is the probability that the next $x$-bar value will fall above the upper control limit? (c) What is the probability that the next two X-bar values will fall above the upper control limit? (d) When the process is actually centered at $32.10$, what proportion of the product will not meet specifications of $32.00+1 -0.25$ units? (e) When the process is actually centered at $32.10$, what will the process capability be in terms of the most appropriate process capability index? S.P.PB. 329
Step by Step Solution
There are 3 Steps involved in it
Step: 1
Get Instant Access to Expert-Tailored Solutions
See step-by-step solutions with expert insights and AI powered tools for academic success
Step: 2
Step: 3
Ace Your Homework with AI
Get the answers you need in no time with our AI-driven, step-by-step assistance
Get Started