

Question
Copy and paste all Minitab output onto this document. Creates a Histogram for each question Decide whether the assumption of normality is satisfied Determine the
Copy and paste all Minitab output onto this document.
Creates a Histogram for each question
Decide whether the assumption of normality is satisfied
Determine the null and alternative
Alpha = 0.05
Run two-sample t test
Make decision
Conclusion
Confidence interval if appropriate
1.A headline in USA Today proclaimed that "Men and Women are Equal Talkers." This referred to a study of the numbers of words that sample of men and women spoke in a day. Using the data set Words.xls, or WordCounts.mtw posted on Blackboard to test the claim that men and women speak the same average number of words in a day? Does there appear to be a difference? If you find a difference, use a confidence interval to determine the difference between the average number of words used by men and women. Use the first two columns of data.
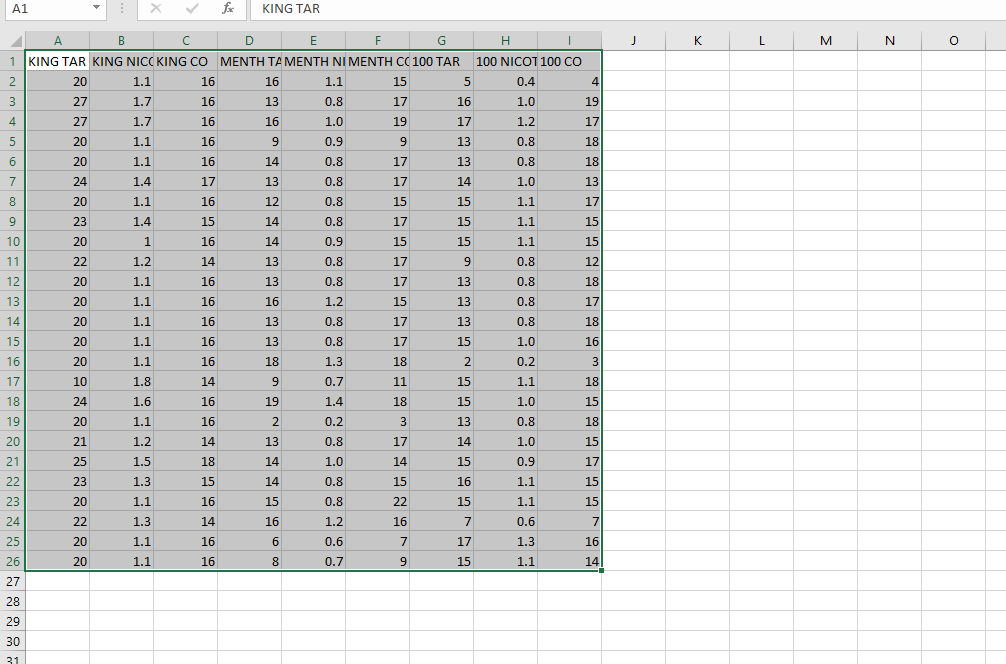
2.Using the CigarettesContents.mtw data to test the claim that 100 mm filtered cigarettes have less tar, on average, than unfiltered king size cigarettes. What does this suggest about the effectiveness of cigarette filters? Use columns C1 and C7.
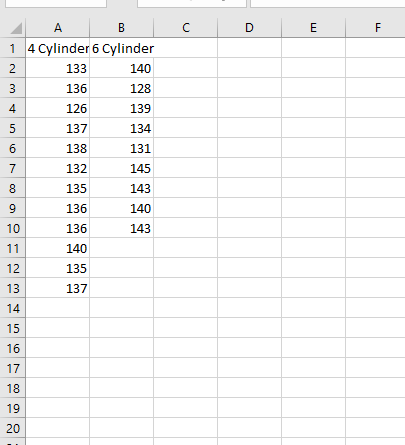
3.A simple random sample of 12 four-cylinder cars is obtained, and the braking distance is measured. A simple random sample of 9 six-cylinder cars is obtained and the braking distance is measured. Test the claim that the mean braking distance of four-cylinder cars is greater than the mean braking distance of six-cylinder cars. Use the Braking Distance file on Blackboard.
4.Use the CigarettesContents.mtw data to test the claim that menthol cigarettes and nonmenthol cigarettes have different amounts of nicotine. Both samples are filtered, 100mm and non-light. Does menthol appear to have an effect on the nicotine content? Use columns C5 and C8.
5.Is the Freshman 15 real? Researchers measured weights of college students in September and April of their freshman year. Test the claim that for the population of college students the mean change in weight from September to April is 0 kg. use the Freshman 15 data set on Blackboard. If you find that the average weight gain is not 0, be sure to calculate a confidence interval for the estimated average weight gain. Does it appear that the Freshman 15 is real, based on this data? Note that the data is in kg, convert to pounds for this exercise. You will have to look up the conversion rate, unless you know it.
Step by Step Solution
There are 3 Steps involved in it
Step: 1

Get Instant Access to Expert-Tailored Solutions
See step-by-step solutions with expert insights and AI powered tools for academic success
Step: 2

Step: 3
Ace Your Homework with AI
Get the answers you need in no time with our AI-driven, step-by-step assistance
Get Started
Quantitative Analysis For Management
Authors: Barry Render, Ralph M. Stair, Michael E. Hanna
11th Edition
9780132997621, 132149117, 132997622, 978-0132149112