Answered step by step
Verified Expert Solution
Question
1 Approved Answer
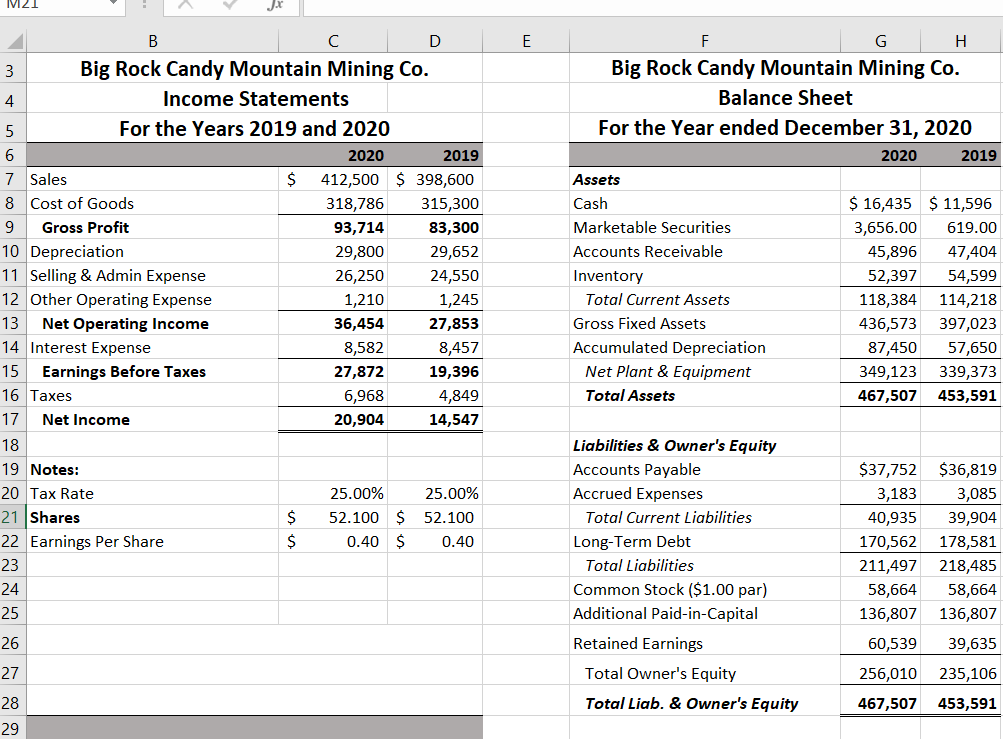
Copy the Big Rock Candy Mountain Mining financial statements from Problem 1 in Chapter 2 into a new workbook. Set up a ratio worksheet similar
- Copy the Big Rock Candy Mountain Mining financial statements from Problem 1 in Chapter 2 into a new workbook.
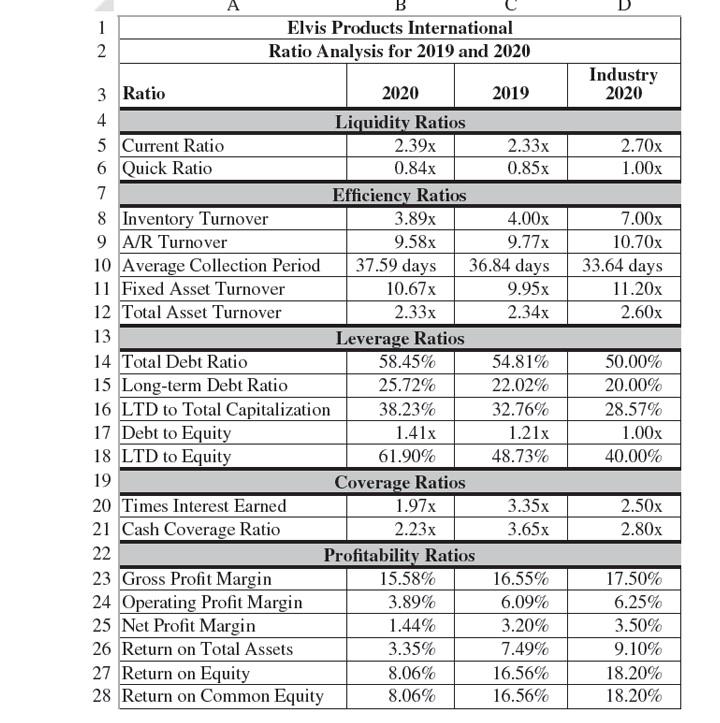
- Set up a ratio worksheet similar to the one in Exhibit 3-6, page 99, and calculate all of the ratios for the firm.
- Identify areas of concern, if any, using the ratios. Identify areas that have shown improvement, if any.
- In 2020 the ROE increased. Explain, in words, why this increase occurred using the DuPont method from equation (3-29). Now use the extended DuPont method from equation (3-33).
- Big Rock Candy Mountain Mining has shown an accounting profit in each of the past two years. Calculate the economic profit for these years and compare it to net income. The WACC is 9%.
- EXIBIT 3-6 is the ELVIS PRODUCTS INTERNATIONAL
-
Step by Step Solution
There are 3 Steps involved in it
Step: 1

Get Instant Access to Expert-Tailored Solutions
See step-by-step solutions with expert insights and AI powered tools for academic success
Step: 2

Step: 3
Ace Your Homework with AI
Get the answers you need in no time with our AI-driven, step-by-step assistance
Get Started