

Answered step by step
Verified Expert Solution
Question
1 Approved Answer
Corporate Finance I What is Mydecos market capitalization at the end of each year? What is Mydecos market-to-book ratio at the end of each year?
Corporate Finance I
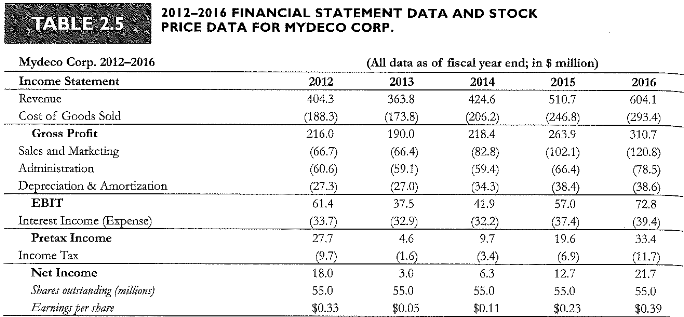
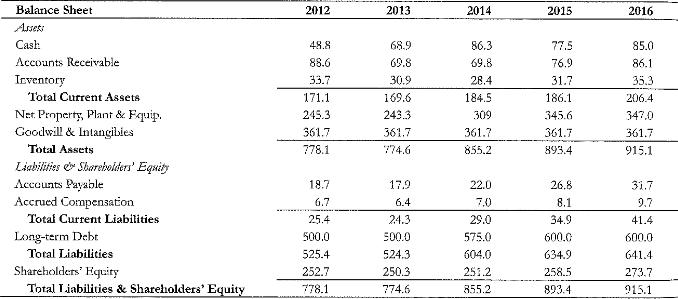
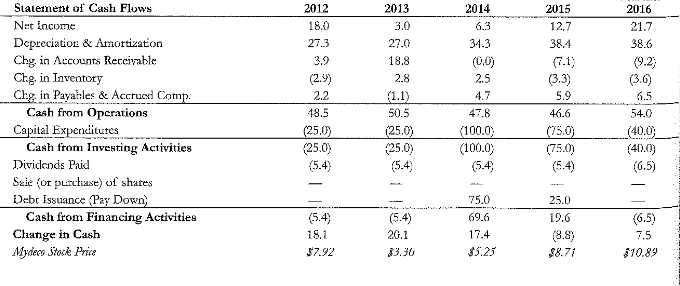
- What is Mydecos market capitalization at the end of each year?
- What is Mydecos market-to-book ratio at the end of each year?
- What is Mydecos enterprise value at the end of each year?
Step by Step Solution
There are 3 Steps involved in it
Step: 1

Get Instant Access to Expert-Tailored Solutions
See step-by-step solutions with expert insights and AI powered tools for academic success
Step: 2

Step: 3
Ace Your Homework with AI
Get the answers you need in no time with our AI-driven, step-by-step assistance
Get Started
Forest Resource Economics And Finance
Authors: W. David Klemperer
1st Edition
0974021105, 978-0974021102