Costco Wholesale Corporation: Financial Statement Analysis
1- Analyze Costcos common-size income statements (See Exhibit 9) by discussing its components and the trends over the five years. There is no threshold.
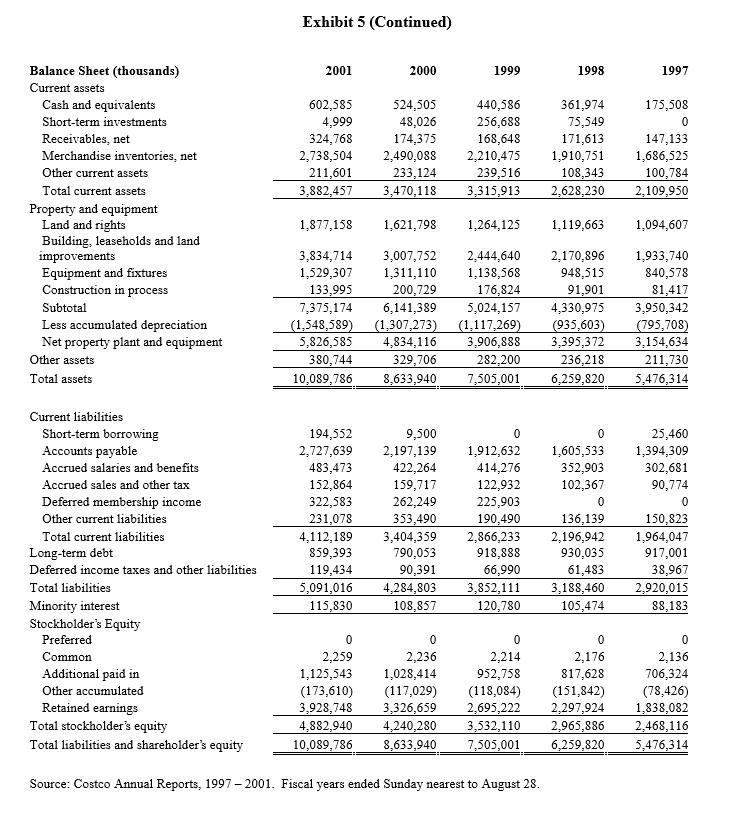
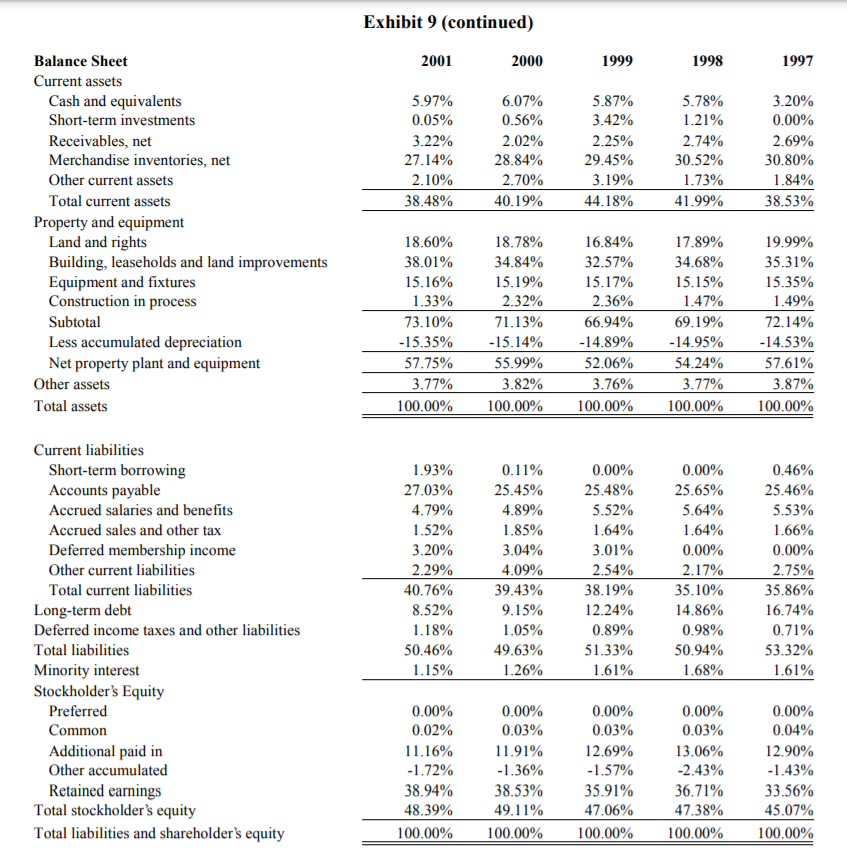
2- Analyze Costcos common-size balance sheets (See Exhibit 9) by discussing its components and the trends over the five years. There is no threshold.
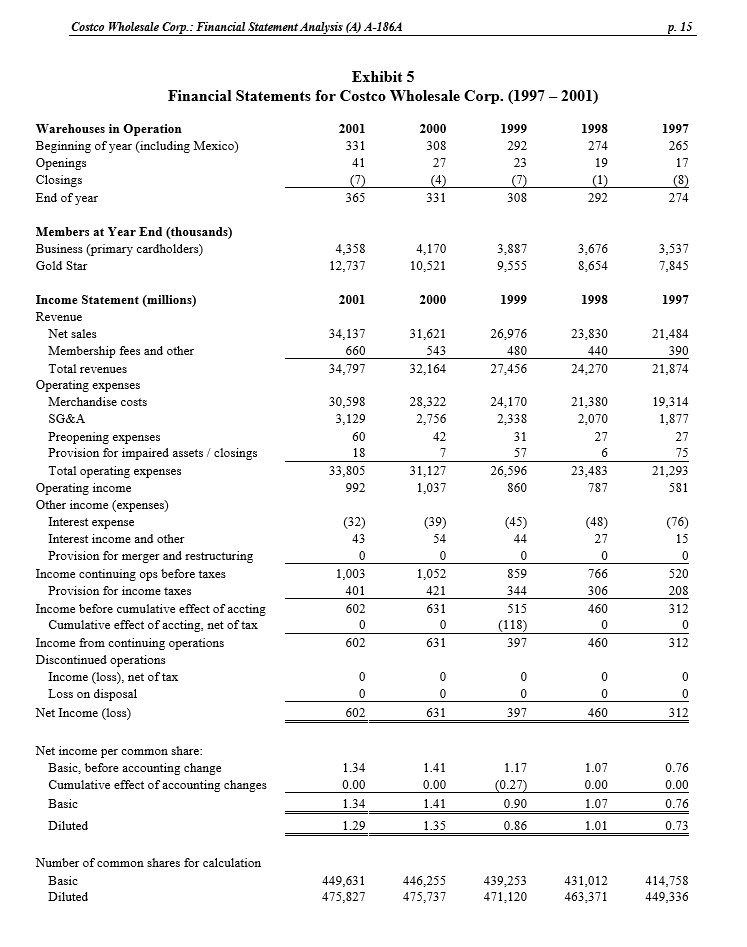
3- Using Costcos sustainable growth model ratios provided in the case, analyze the changes over the five years in ROE, Dividend payout, ROA, Financial leverage, Asset turnover, Net Profit/Income margin (also referred to as Net margin), Pre-tax income & Net income (See Exhibit 10).
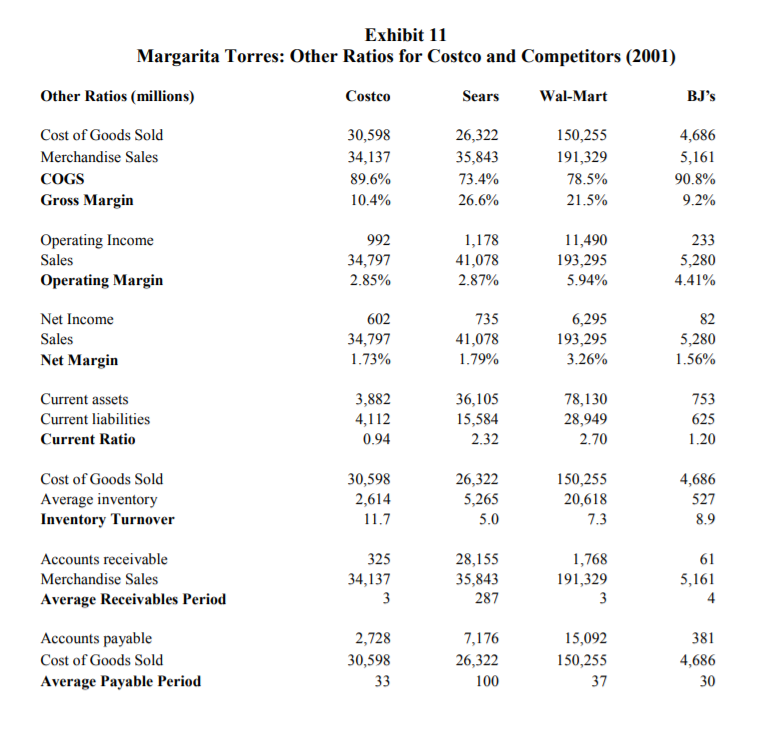
4- Benchmark and analyze the following ratios among the four competitors (Costco, Sears, Wal-Mart, and BJs) See Exhibit 11:
Gross profit margin (or Gross margin) Operating profit margin (or Operating margin)
Net profit margin (or Net margin)
Current ratio Inventory turnover
Average receivables period (Receivables collection period)
Average payables period (Days of payables outstanding)
5- Based on the information given in the case and your above analysis, which of the four companies would give you a warning sign for potential earnings management? Explain your answer.
Costco Wholesale Corp.: Financial Statement Analysis (A) A-1864 p. 15 Exhibit 5 Financial Statements for Costco Wholesale Corp. (1997 2001) Warehouses in Operation 2001 2000 1999 1998 Beginning of year (including Mexico) 331 308 292 274 Openings 41 23 Closings End of year 331 292 27 19 1997 265 17 (8) 274 365 308 Members at Year End (thousands) Business (primary cardholders) Gold Star 4,358 12,737 4,170 10,521 3,887 9,555 3,676 8,654 3,537 7,845 2001 2000 1999 1998 1997 34,137 660 34,797 31,621 543 32,164 26,976 480 27,456 23,830 440 24,270 21,484 390 21,874 30,598 3,129 60 18 33,805 992 28,322 2,756 42 7 31,127 1,037 24.170 2,338 31 57 26,596 860 21,380 2,070 27 6 23.483 787 19,314 1,877 27 75 21,293 581 Income Statement (millions) Revenue Net sales Membership fees and other Total revenues Operating expenses Merchandise costs SG&A Preopening expenses Provision for impaired assets/closings Total operating expenses Operating income Other income (expenses) Interest expense Interest income and other Provision for merger and restructuring Income continuing ops before taxes Provision for income taxes Income before cumulative effect of accting Cumulative effect of accting, net of tax Income from continuing operations Discontinued operations Income (loss), net of tax Loss on disposal Net Income (loss) (32) 43 0 1,003 401 602 0 602 (39) 54 0 1,052 421 631 0 631 (45) 44 0 859 344 515 (118) 397 (48) 27 0 766 306 460 0 460 (76) 15 0 520 208 312 0 312 0 0 0 602 0 0 631 0 0 397 0 0 460 0 312 Net income per common share: Basic, before accounting change Cumulative effect of accounting changes Basic Diluted 1.34 0.00 1.41 0.00 1.41 1.17 (0.27) 0.90 1.07 0.00 1.07 0.76 0.00 1.34 0.76 1.29 1.35 0.86 1.01 0.73 Number of common shares for calculation Basic Diluted 449,631 475,827 446,255 475,737 439,253 471,120 431,012 463,371 414,758 449,336 Exhibit 5 (Continued) 2001 2000 1999 1998 1997 602,585 4,999 324,768 2,738,504 211,601 3.882,457 524,505 48,026 174,375 2,490,088 233,124 3,470,118 440,586 256,688 168,648 2,210,475 239,516 3,315,913 361,974 75,549 171,613 1,910,751 108,343 2,628,230 175,508 0 147,133 1,686,525 100,784 2,109,950 Balance Sheet (thousands) Current assets Cash and equivalents Short-term investments Receivables, net Merchandise inventories, net Other current assets Total current assets Property and equipment Land and rights Building, leaseholds and land improvements Equipment and fixtures Construction in process Subtotal Less accumulated depreciation Net property plant and equipment Other assets Total assets 1,877,158 1,621,798 1,264,125 1,119,663 1,094,607 3,834,714 1,529,307 133,995 7,375,174 (1,548,589) 5,826,585 380,744 10,089,786 3,007,752 1,311,110 200,729 6,141,389 (1,307,273) 4,834,116 329,706 8,633,940 2.444,640 1,138,568 176,824 5,024,157 (1.117,269) 3,906,888 282,200 7,505,001 2,170,896 948,515 91,901 4,330,975 (935,603) 3,395,372 236,218 6,259,820 1,933,740 840,578 81,417 3,950,342 (795,708) 3,154,634 211,730 5,476,314 Current liabilities Short-term borrowing Accounts payable Accrued salaries and benefits Accrued sales and other tax Deferred membership income Other current liabilities Total current liabilities Long-term debt Deferred income taxes and other liabilities Total liabilities Minority interest Stockholder's Equity Preferred Common Additional paid in Other accumulated Retained earnings Total stockholder's equity Total liabilities and shareholder's equity 194,552 2,727,639 483,473 152,864 322,583 231,078 4,112,189 859,393 119,434 5,091,016 115,830 9,500 2,197,139 422,264 159,717 262,249 353,490 3,404,359 790,053 90,391 4,284,803 108,857 0 1,912,632 414,276 122,932 225,903 190,490 2,866,233 918,888 66,990 3,852,111 120,780 0 1,605,533 352,903 102,367 0 136,139 2,196,942 930,035 61,483 3,188,460 105,474 25,460 1,394,309 302,681 90,774 0 150,823 1,964,047 917,001 38,967 2.920,015 88,183 0 2,259 1,125,543 (173,610) 3,928,748 4.882,940 10,089,786 0 2,236 1,028,414 (117,029) 3,326,659 4,240,280 8,633,940 0 2,214 952,758 (118,084) 2,695,222 3,532,110 7,505,001 0 2,176 817,628 (151,842) 2,297,924 2,965,886 6,259,820 0 2,136 706,324 (78,426) 1,838,082 2,468,116 5,476,314 Source: Costco Annual Reports, 1997 2001. Fiscal years ended Sunday nearest to August 28. Exhibit 9 (continued) 2001 2000 1999 1998 1997 5.97% 0.05% 3.22% 27.14% 2.10% 38.48% 6.07% 0.56% 2.02% 28.84% 2.70% 40.19% 5.87% 3.42% 2.25% 29.45% 3.19% 44.18% 5.78% 1.21% 2.74% 30.52% 1.73% 41.99% 3.20% 0.00% 2.69% 30.80% 1.84% 38.53% Balance Sheet Current assets Cash and equivalents Short-term investments Receivables, net Merchandise inventories, net Other current assets Total current assets Property and equipment Land and rights Building, leaseholds and land improvements Equipment and fixtures Construction in process Subtotal Less accumulated depreciation Net property plant and equipment Other assets Total assets 18.60% 38.01% 15.16% 1.33% 73.10% -15.35% 57.75% 3.77% 100.00% 18.78% 34.84% 15.19% 2.32% 71.13% -15.14% 55.99% 3.82% 100.00% 16.84% 32.57% 15.17% 2.36% 66.94% -14.89% 52.06% 3.76% 100.00% 17.89% 34.68% 15.15% 1.47% 69.19% -14.95% 54.24% 3.77% 100.00% 19.99% 35.31% 15.35% 1.49% 72.14% -14.53% 57.61% 3.87% 100.00% Current liabilities Short-term borrowing Accounts payable Accrued salaries and benefits Accrued sales and other tax Deferred membership income Other current liabilities Total current liabilities Long-term debt Deferred income taxes and other liabilities Total liabilities Minority interest Stockholders Equity Preferred Common Additional paid in Other accumulated Retained earnings Total stockholder's equity Total liabilities and shareholder's equity 1.93% 27.03% 4.79% 1.52% 3.20% 2.29% 40.76% 8.52% 1.18% 50.46% 1.15% 0.11% 25.45% 4.89% 1.85% 3.04% 4.09% 39.43% 9.15% 1.05% 49.63% 1.26% 0.00% 25.48% 5.52% 1.64% 3.01% 2.54% 38.19% 12.24% 0.89% 51.33% 1.61% 0.00% 25.65% 5.64% 1.64% 0.00% 2.17% 35.10% 14.86% 0.98% 50.94% 1.68% 0.46% 25.46% 5.53% 1.66% 0.00% 2.75% 35.86% 16.74% 0.71% 53.32% 1.61% 0.00% 0.02% 11.16% -1.72% 38.94% 48.39% 100.00% 0.00% 0.03% 11.91% -1.36% 38.53% 49.11% 100.00% 0.00% 0.03% 12.69% -1.57% 35.91% 47.06% 100.00% 0.00% 0.03% 13.06% -2.43% 36.71% 47.38% 100.00% 0.00% 0.04% 12.90% -1.43% 33.56% 45.07% 100.00% Exhibit 11 Margarita Torres: Other Ratios for Costco and Competitors (2001) Other Ratios (millions) Costco Sears Wal-Mart BJ's Cost of Goods Sold Merchandise Sales COGS Gross Margin 30,598 34,137 89.6% 10.4% 26,322 35,843 73.4% 26.6% 150,255 191,329 78.5% 21.5% 4,686 5,161 90.8% 9.2% 992 34,797 2.85% 1,178 41,078 2.87% 11,490 193,295 5.94% 233 5,280 4.41% Operating Income Sales Operating Margin Net Income Sales Net Margin 82 602 34,797 1.73% 735 41,078 1.79% 6,295 193,295 3.26% 5,280 1.56% Current assets Current liabilities Current Ratio 3,882 4,112 0.94 36,105 15,584 2.32 78,130 28,949 2.70 753 625 1.20 Cost of Goods Sold Average inventory Inventory Turnover 30,598 2,614 11.7 26,322 5,265 150,255 20,618 4,686 527 8.9 5.0 7.3 Accounts receivable Merchandise Sales Average Receivables Period 325 34,137 3 28,155 35,843 287 1,768 191,329 3 61 5,161 4 Accounts payable Cost of Goods Sold Average Payable Period 2,728 30,598 33 7,176 26,322 100 15,092 150,255 37 381 4,686 30 Costco Wholesale Corp.: Financial Statement Analysis (A) A-1864 p. 15 Exhibit 5 Financial Statements for Costco Wholesale Corp. (1997 2001) Warehouses in Operation 2001 2000 1999 1998 Beginning of year (including Mexico) 331 308 292 274 Openings 41 23 Closings End of year 331 292 27 19 1997 265 17 (8) 274 365 308 Members at Year End (thousands) Business (primary cardholders) Gold Star 4,358 12,737 4,170 10,521 3,887 9,555 3,676 8,654 3,537 7,845 2001 2000 1999 1998 1997 34,137 660 34,797 31,621 543 32,164 26,976 480 27,456 23,830 440 24,270 21,484 390 21,874 30,598 3,129 60 18 33,805 992 28,322 2,756 42 7 31,127 1,037 24.170 2,338 31 57 26,596 860 21,380 2,070 27 6 23.483 787 19,314 1,877 27 75 21,293 581 Income Statement (millions) Revenue Net sales Membership fees and other Total revenues Operating expenses Merchandise costs SG&A Preopening expenses Provision for impaired assets/closings Total operating expenses Operating income Other income (expenses) Interest expense Interest income and other Provision for merger and restructuring Income continuing ops before taxes Provision for income taxes Income before cumulative effect of accting Cumulative effect of accting, net of tax Income from continuing operations Discontinued operations Income (loss), net of tax Loss on disposal Net Income (loss) (32) 43 0 1,003 401 602 0 602 (39) 54 0 1,052 421 631 0 631 (45) 44 0 859 344 515 (118) 397 (48) 27 0 766 306 460 0 460 (76) 15 0 520 208 312 0 312 0 0 0 602 0 0 631 0 0 397 0 0 460 0 312 Net income per common share: Basic, before accounting change Cumulative effect of accounting changes Basic Diluted 1.34 0.00 1.41 0.00 1.41 1.17 (0.27) 0.90 1.07 0.00 1.07 0.76 0.00 1.34 0.76 1.29 1.35 0.86 1.01 0.73 Number of common shares for calculation Basic Diluted 449,631 475,827 446,255 475,737 439,253 471,120 431,012 463,371 414,758 449,336 Exhibit 5 (Continued) 2001 2000 1999 1998 1997 602,585 4,999 324,768 2,738,504 211,601 3.882,457 524,505 48,026 174,375 2,490,088 233,124 3,470,118 440,586 256,688 168,648 2,210,475 239,516 3,315,913 361,974 75,549 171,613 1,910,751 108,343 2,628,230 175,508 0 147,133 1,686,525 100,784 2,109,950 Balance Sheet (thousands) Current assets Cash and equivalents Short-term investments Receivables, net Merchandise inventories, net Other current assets Total current assets Property and equipment Land and rights Building, leaseholds and land improvements Equipment and fixtures Construction in process Subtotal Less accumulated depreciation Net property plant and equipment Other assets Total assets 1,877,158 1,621,798 1,264,125 1,119,663 1,094,607 3,834,714 1,529,307 133,995 7,375,174 (1,548,589) 5,826,585 380,744 10,089,786 3,007,752 1,311,110 200,729 6,141,389 (1,307,273) 4,834,116 329,706 8,633,940 2.444,640 1,138,568 176,824 5,024,157 (1.117,269) 3,906,888 282,200 7,505,001 2,170,896 948,515 91,901 4,330,975 (935,603) 3,395,372 236,218 6,259,820 1,933,740 840,578 81,417 3,950,342 (795,708) 3,154,634 211,730 5,476,314 Current liabilities Short-term borrowing Accounts payable Accrued salaries and benefits Accrued sales and other tax Deferred membership income Other current liabilities Total current liabilities Long-term debt Deferred income taxes and other liabilities Total liabilities Minority interest Stockholder's Equity Preferred Common Additional paid in Other accumulated Retained earnings Total stockholder's equity Total liabilities and shareholder's equity 194,552 2,727,639 483,473 152,864 322,583 231,078 4,112,189 859,393 119,434 5,091,016 115,830 9,500 2,197,139 422,264 159,717 262,249 353,490 3,404,359 790,053 90,391 4,284,803 108,857 0 1,912,632 414,276 122,932 225,903 190,490 2,866,233 918,888 66,990 3,852,111 120,780 0 1,605,533 352,903 102,367 0 136,139 2,196,942 930,035 61,483 3,188,460 105,474 25,460 1,394,309 302,681 90,774 0 150,823 1,964,047 917,001 38,967 2.920,015 88,183 0 2,259 1,125,543 (173,610) 3,928,748 4.882,940 10,089,786 0 2,236 1,028,414 (117,029) 3,326,659 4,240,280 8,633,940 0 2,214 952,758 (118,084) 2,695,222 3,532,110 7,505,001 0 2,176 817,628 (151,842) 2,297,924 2,965,886 6,259,820 0 2,136 706,324 (78,426) 1,838,082 2,468,116 5,476,314 Source: Costco Annual Reports, 1997 2001. Fiscal years ended Sunday nearest to August 28. Exhibit 9 (continued) 2001 2000 1999 1998 1997 5.97% 0.05% 3.22% 27.14% 2.10% 38.48% 6.07% 0.56% 2.02% 28.84% 2.70% 40.19% 5.87% 3.42% 2.25% 29.45% 3.19% 44.18% 5.78% 1.21% 2.74% 30.52% 1.73% 41.99% 3.20% 0.00% 2.69% 30.80% 1.84% 38.53% Balance Sheet Current assets Cash and equivalents Short-term investments Receivables, net Merchandise inventories, net Other current assets Total current assets Property and equipment Land and rights Building, leaseholds and land improvements Equipment and fixtures Construction in process Subtotal Less accumulated depreciation Net property plant and equipment Other assets Total assets 18.60% 38.01% 15.16% 1.33% 73.10% -15.35% 57.75% 3.77% 100.00% 18.78% 34.84% 15.19% 2.32% 71.13% -15.14% 55.99% 3.82% 100.00% 16.84% 32.57% 15.17% 2.36% 66.94% -14.89% 52.06% 3.76% 100.00% 17.89% 34.68% 15.15% 1.47% 69.19% -14.95% 54.24% 3.77% 100.00% 19.99% 35.31% 15.35% 1.49% 72.14% -14.53% 57.61% 3.87% 100.00% Current liabilities Short-term borrowing Accounts payable Accrued salaries and benefits Accrued sales and other tax Deferred membership income Other current liabilities Total current liabilities Long-term debt Deferred income taxes and other liabilities Total liabilities Minority interest Stockholders Equity Preferred Common Additional paid in Other accumulated Retained earnings Total stockholder's equity Total liabilities and shareholder's equity 1.93% 27.03% 4.79% 1.52% 3.20% 2.29% 40.76% 8.52% 1.18% 50.46% 1.15% 0.11% 25.45% 4.89% 1.85% 3.04% 4.09% 39.43% 9.15% 1.05% 49.63% 1.26% 0.00% 25.48% 5.52% 1.64% 3.01% 2.54% 38.19% 12.24% 0.89% 51.33% 1.61% 0.00% 25.65% 5.64% 1.64% 0.00% 2.17% 35.10% 14.86% 0.98% 50.94% 1.68% 0.46% 25.46% 5.53% 1.66% 0.00% 2.75% 35.86% 16.74% 0.71% 53.32% 1.61% 0.00% 0.02% 11.16% -1.72% 38.94% 48.39% 100.00% 0.00% 0.03% 11.91% -1.36% 38.53% 49.11% 100.00% 0.00% 0.03% 12.69% -1.57% 35.91% 47.06% 100.00% 0.00% 0.03% 13.06% -2.43% 36.71% 47.38% 100.00% 0.00% 0.04% 12.90% -1.43% 33.56% 45.07% 100.00% Exhibit 11 Margarita Torres: Other Ratios for Costco and Competitors (2001) Other Ratios (millions) Costco Sears Wal-Mart BJ's Cost of Goods Sold Merchandise Sales COGS Gross Margin 30,598 34,137 89.6% 10.4% 26,322 35,843 73.4% 26.6% 150,255 191,329 78.5% 21.5% 4,686 5,161 90.8% 9.2% 992 34,797 2.85% 1,178 41,078 2.87% 11,490 193,295 5.94% 233 5,280 4.41% Operating Income Sales Operating Margin Net Income Sales Net Margin 82 602 34,797 1.73% 735 41,078 1.79% 6,295 193,295 3.26% 5,280 1.56% Current assets Current liabilities Current Ratio 3,882 4,112 0.94 36,105 15,584 2.32 78,130 28,949 2.70 753 625 1.20 Cost of Goods Sold Average inventory Inventory Turnover 30,598 2,614 11.7 26,322 5,265 150,255 20,618 4,686 527 8.9 5.0 7.3 Accounts receivable Merchandise Sales Average Receivables Period 325 34,137 3 28,155 35,843 287 1,768 191,329 3 61 5,161 4 Accounts payable Cost of Goods Sold Average Payable Period 2,728 30,598 33 7,176 26,322 100 15,092 150,255 37 381 4,686 30