Answered step by step
Verified Expert Solution
Question
1 Approved Answer
Could anyone help me with this data mining question with Python. You could just provide me the core coding part (shown as the star part).
Could anyone help me with this data mining question with Python. You could just provide me the core coding part (shown as the star part).
Code:
import pandas as pd import numpy as np import matplotlib.pyplot as plt
df = pd.read_csv(filepath_or_buffer='2017-2.csv', header=0) df
def site_max_by_day():
**********
**********
**********
df.to_csv("./2017-"+str(StationID)+".csv", header=False,index=False)

Thank you so much!
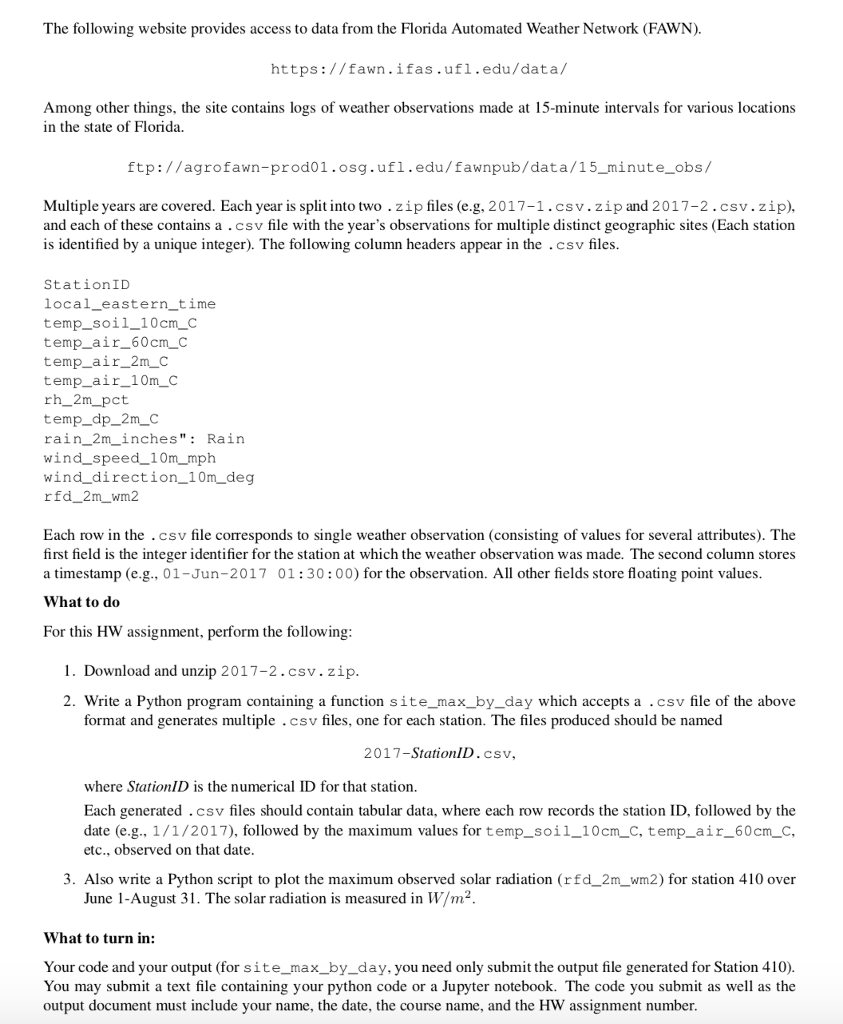
The following website provides access to data from the Florida Automated Weather Network (FAWN). https://fawn.ifas.ufl.edu/data/ Among other things, the site contains logs of weather observations made at 15-minute intervals for various locations in the state of Florida. ftp://agrofawn-prod01.osg.ufl.edu/fawnpub/data/15_minute_obs Multiple years are covered. Each year is split into two .zip files (e.g, 2017-1.csv.zipand 2017-2.csv.zip), and each of these contains a .csv file with the year's observations for multiple distinct geographic sites (Each station is identified by a unique integer). The following column headers appear in the .csv files StationID local_eastern_time temp_soil_10cm_c temp_air_60cm C temp_air_2mC temp_air_10m(C rh_2m_pct temp_dp_2m_C rain_2m_inches": Rain wind_speed 10m_mph wind_ direction_10m_deg rfd_2m_ wm2 Each row in the . csv file corresponds to single weather observation (consisting of values for several attributes). The first field is the integer identifier for the station at which the weather observation was made. The second column stores a timestamp (e.g., 01-Jun-2017 01:30:00) for the observation. All other fields store floating point values What to do assignment, perform the following 1. Download and unzip 2017-2.csv. zip 2. Write a Python program containing a function site_max_by_day which accepts a .csv file of the above format and generates multiple .csv files, one for each station. The files produced should be named 2017-StationID.csv, where StationID is the numerical ID for that station Each generated .csv files should contain tabular data, where each row records the station ID, followed by the date (e.g., 1/1/2017), followed by the maximum values for temp_soil_10cm_C, temp_air_60cm_c etc.. observed on that date 3. Also write a Python script to plot the maximum observed solar radiation (rfd_2m_wm2) for station 410 over June 1-August 31. The solar radiation is measured in W/m2 What to turn in: Your code and your output (for site_max_by_day, you need only submit the output file generated for Station 410) You may submit a text file containing your python code or a Jupyter notebook. The code you submit as well as the output document must include your name, the date, the course name, and the HW assignment numberStep by Step Solution
There are 3 Steps involved in it
Step: 1

Get Instant Access to Expert-Tailored Solutions
See step-by-step solutions with expert insights and AI powered tools for academic success
Step: 2

Step: 3

Ace Your Homework with AI
Get the answers you need in no time with our AI-driven, step-by-step assistance
Get Started


