

Question
Could I get some help with this Make scatter diagram. Be sure to include axis titles on your graph and a trend line with the
Could I get some help with this
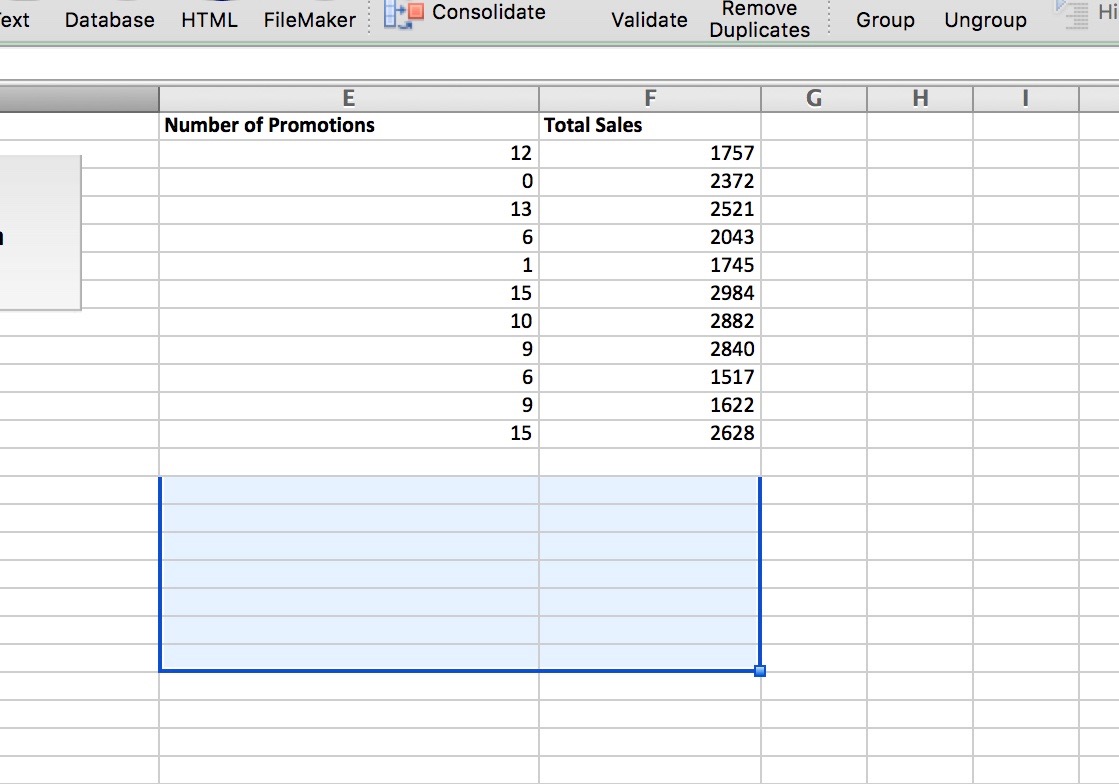
Make scatter diagram. Be sure to include axis titles on your graph and a trend line with the equation.
Calculate the sample covariance and sample correlation coefficient.
- Discuss the results of the correlation coefficient and scatter diagram. Is there a possible relationship between the number of promotions and total sales? Explain and use your results to back up your statements. This needs to be at least one paragraph in
length. at least three complete sentences.
- What are the limitations of the correlation coefficient? Explain.
- Run a linear regression using Excel's Data Analysis regression tool. Construct the linear regression equation and determine the predicted total sales value if the number of promotions is 7. Is the regression model significant? Clearly explain your reasoning using the regression results.
Step by Step Solution
There are 3 Steps involved in it
Step: 1

Get Instant Access to Expert-Tailored Solutions
See step-by-step solutions with expert insights and AI powered tools for academic success
Step: 2

Step: 3
Ace Your Homework with AI
Get the answers you need in no time with our AI-driven, step-by-step assistance
Get Started
Linear Algebra A Modern Introduction
Authors: David Poole
4th edition
1285463242, 978-1285982830, 1285982835, 978-1285463247