Could I please get some with this?
I got an expert answer, but not clear as to what I need to do with the numbers?
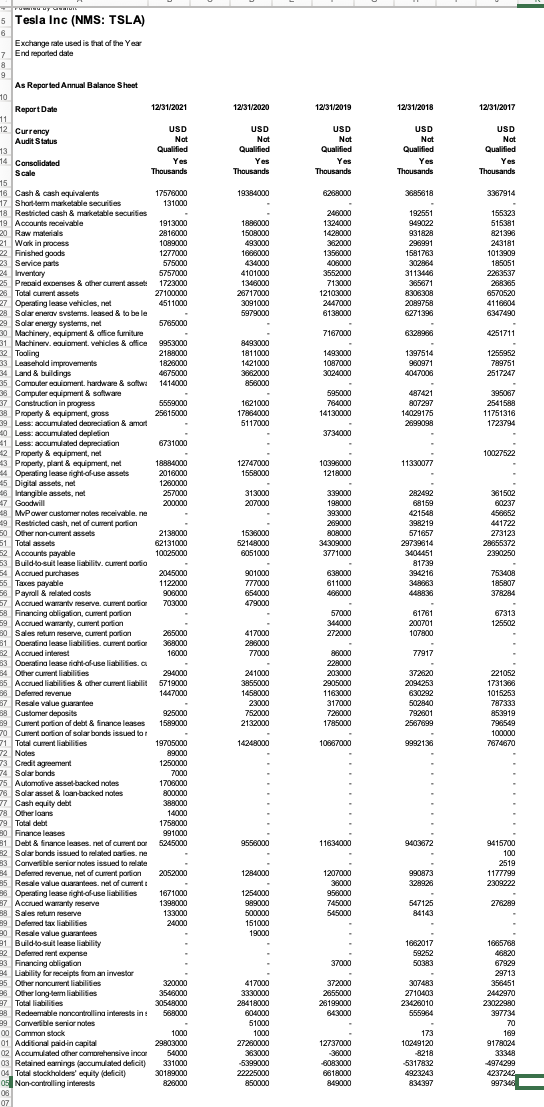
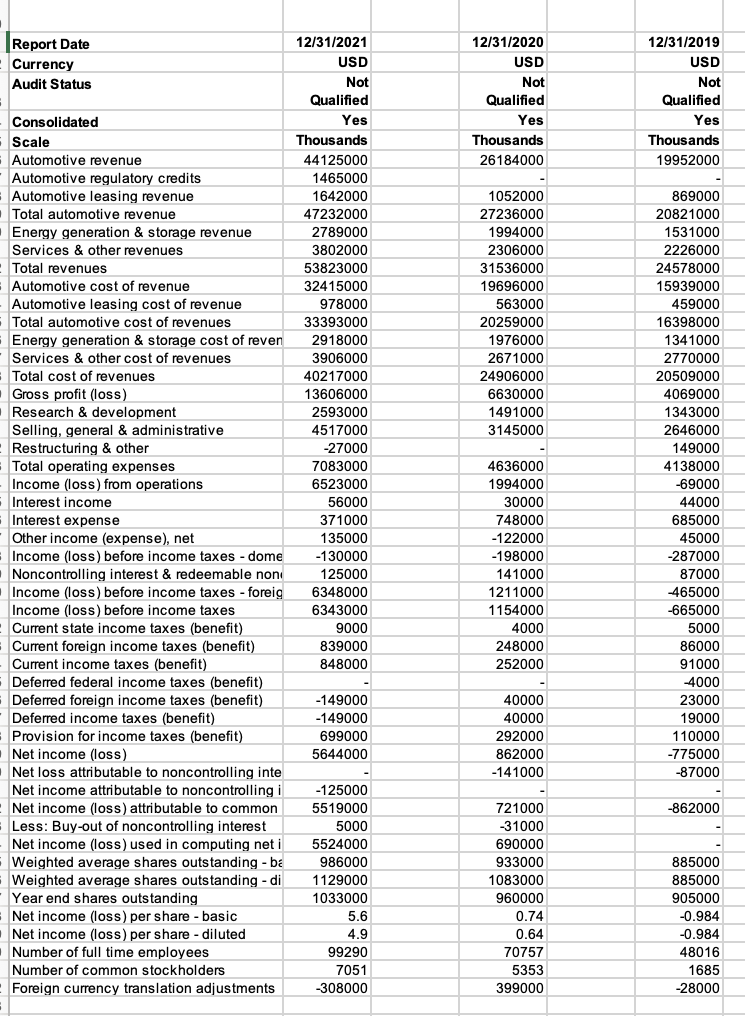
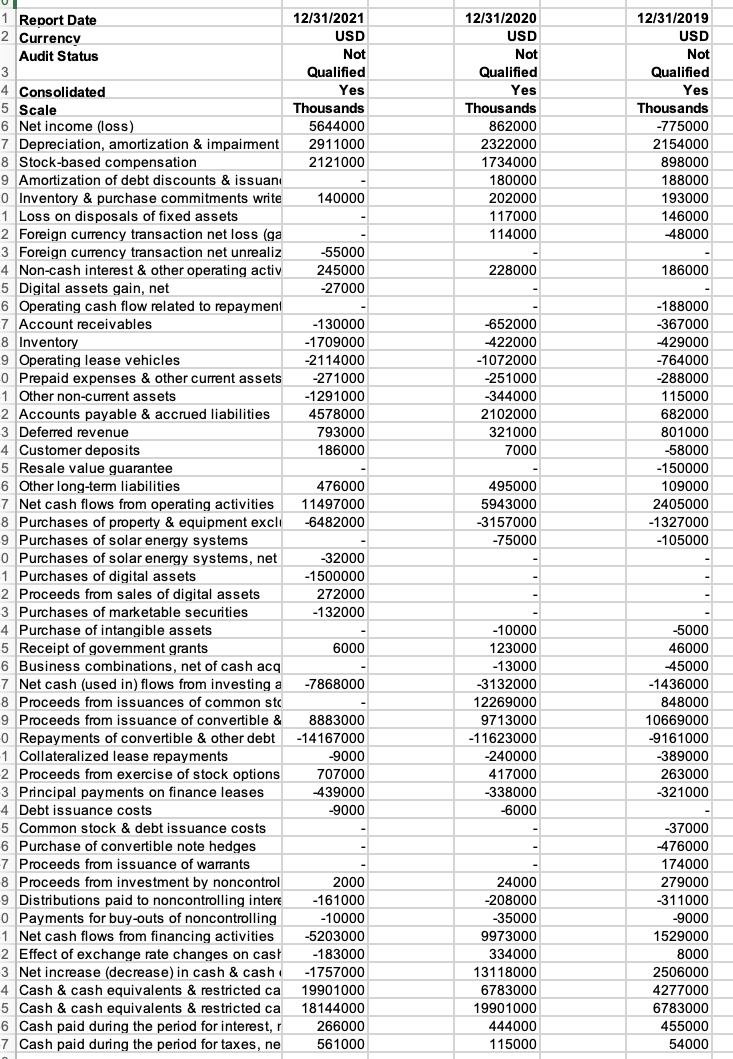
Overview Working capital management is critical to an organization's ability to meet its short-term obligations. When proposing new projects or investment ideas for corporations, it is critical to consider working capital red flags such as excess credit use by the business or a low cash balance. Managing such issues early on can help corporations acquire a competitive advantage in the marketplace. Prompt Using the business you selected for Project Two, complete the calculations for determining working capital, and describe their relevance in assessing financial health. Specifically, you must address the following rubric criteria: Financial Statement(s): Explain the various financial statement(s) needed to calculate a business's working capital and how each financial statement is used. Provide examples to support your claims. Working Capital's Role: Discuss how effective working capital management supports a healthy business. Working Capital Interpretation: Use the appropriate formula to calculate working capital, then discuss the business's current financial liquidity position. o For example, does the business have sufficient working capital on hand to address bills to suppliers? Will there be potential cash inflow at the end of the year? Working Capital Management Direction: Discuss the current direction of the business regarding working capital management. o keep in mind that financial statements reflect a specific moment or period of time and the value of the business's working capital during that period. To get a better understanding of the direction in which a business is going, use the business's balance sheets from Mergent Online to compare the business's value today against its value from one year ago Tesla Inc (NMS: TSLA) Audits ul. Report Date Currency Audit Status 12/31/2020 USD Not Qualified 12/31/2019 USD Not Qualified Yes Yes Thousands 26184000 Thousands 19952000 12/31/2021 USD Not Qualified Yes Thousands 44125000 1465000 1642000 47232000 2789000 3802000 53823000 32415000 978000 33393000 2918000 3906000 40217000 13606000 2593000 4517000 -27000 7083000 6523000 56000 371000 135000 -130000 125000 6348000 6343000 9000 839000 848000 Consolidated Scale Automotive revenue Automotive regulatory credits Automotive leasing revenue Total automotive revenue Energy generation & storage revenue Services & other revenues Total revenues Automotive cost of revenue Automotive leasing cost of revenue Total automotive cost of revenues Energy generation & storage cost of reven Services & other cost of revenues Total cost of revenues Gross profit (loss) Research & development Selling, general & administrative Restructuring & other Total operating expenses Income (loss) from operations Interest income Interest expense Other income (expense), net Income (loss) before income taxes - dome Noncontrolling interest & redeemable non Income (loss) before income taxes - foreig Income (loss) before income taxes Current state income taxes (benefit) Current foreign income taxes (benefit) Current income taxes (benefit) Deferred federal income taxes (benefit) Deferred foreign income taxes (benefit) Deferred income taxes (benefit) Provision for income taxes (benefit) Net income (loss) Net loss attributable to noncontrolling inte Net income attributable to noncontrolling i Net income (loss) attributable to common Less: Buy-out of noncontrolling interest Net income (loss) used in computing net i Weighted average shares outstanding - ba Weighted average shares outstanding - di Year end shares outstanding Net income (oss) per share - basic Net income (loss) per share - diluted Number of full time employees Number of common stockholders Foreign currency translation adjustments 1052000 27236000 1994000 2306000 31536000 19696000 563000 20259000 1976000 2671000 24906000 6630000 1491000 3145000 4636000 1994000 30000 748000 -122000 -198000 141000 1211000 1154000 4000 248000 252000 869000 20821000 1531000 2226000 24578000 15939000 459000 16398000 1341000 2770000 20509000 4069000 1343000 2646000 149000 4138000 -69000 44000 685000 45000 -287000 87000 465000 -665000 5000 86000 91000 4000 23000 19000 110000 -775000 -87000 -149000 -149000 699000 5644000 40000 40000 292000 862000 -141000 -862000 -125000 5519000 5000 5524000 986000 1129000 1033000 5.6 4.9 99290 7051 -308000 721000 -31000 690000 933000 1083000 960000 0.74 0.64 70757 5353 399000 885000 885000 905000 -0.984 -0.984 48016 1685 -28000 12/31/2020 USD Not Qualified Yes Thousands 862000 2322000 1734000 180000 202000 117000 114000 12/31/2019 USD Not Qualified Yes Thousands -775000 2154000 898000 188000 193000 146000 48000 228000 186000 -652000 422000 -1072000 -251000 -344000 2102000 321000 7000 1 Report Date 12/31/2021 2 Currency USD Audit Status Not 3 Qualified 4 Consolidated Yes 5 Scale Thousands 6 Net income (loss) 5644000 7 Depreciation, amortization & impairment 2911000 8 Stock-based compensation 2121000 9 Amortization of debt discounts & issuan 0 Inventory & purchase commitments write 140000 1 Loss on disposals of fixed assets 2 Foreign currency transaction net loss (ga 3 Foreign currency transaction net unrealiz -55000 4 Non-cash interest & other operating activ 245000 5 Digital assets gain, net -27000 6 Operating cash flow related to repayment 7 Account receivables -130000 8 Inventory -1709000 9 Operating lease vehicles -2114000 o Prepaid expenses & other current assets -271000 1 Other non-current assets -1291000 2 Accounts payable & accrued liabilities 4578000 3 Deferred revenue 793000 4 Customer deposits 186000 5 Resale value guarantee 6 Other long-term liabilities 476000 7 Net cash flows from operating activities 11497000 8 Purchases of property & equipment excli -6482000 9 Purchases of solar energy systems o Purchases of solar energy systems, net -32000 1 Purchases of digital assets -1500000 2 Proceeds from sales of digital assets 272000 3 Purchases of marketable securities -132000 4 Purchase of intangible assets 5 Receipt of government grants 6000 6 Business combinations, net of cash acq 7 Net cash (used in) flows from investing a -7868000 8 Proceeds from issuances of common sto 9 Proceeds from issuance of convertible & 8883000 o Repayments of convertible & other debt -14167000 -1 Collateralized lease repayments -9000 2 Proceeds from exercise of stock options 707000 3 Principal payments on finance leases 439000 4 Debt issuance costs -9000 5 Common stock & debt issuance costs 6 Purchase of convertible note hedges 7 Proceeds from issuance of warrants 8 Proceeds from investment by noncontrol 2000 9 Distributions paid to noncontrolling intere -161000 o Payments for buy-outs of noncontrolling -10000 1 Net cash flows from financing activities -5203000 2 Effect of exchange rate changes on cast -183000 3 Net increase (decrease) in cash & cash -1757000 4 Cash & cash equivalents & restricted ca 19901000 5 Cash & cash equivalents & restricted ca 18144000 6 Cash paid during the period for interest, 266000 7 Cash paid during the period for taxes, ne 561000 -188000 -367000 429000 -764000 -288000 115000 682000 801000 -58000 -150000 109000 2405000 -1327000 -105000 495000 5943000 -3157000 -75000 -10000 123000 -13000 -3132000 12269000 9713000 -11623000 -240000 417000 -338000 -6000 -5000 46000 -45000 -1436000 848000 10669000 -9161000 -389000 263000 -321000 24000 -208000 -35000 9973000 334000 13118000 6783000 19901000 444000 115000 -37000 476000 174000 279000 -311000 -9000 1529000 8000 2506000 4277000 6783000 455000 54000 Overview Working capital management is critical to an organization's ability to meet its short-term obligations. When proposing new projects or investment ideas for corporations, it is critical to consider working capital red flags such as excess credit use by the business or a low cash balance. Managing such issues early on can help corporations acquire a competitive advantage in the marketplace. Prompt Using the business you selected for Project Two, complete the calculations for determining working capital, and describe their relevance in assessing financial health. Specifically, you must address the following rubric criteria: Financial Statement(s): Explain the various financial statement(s) needed to calculate a business's working capital and how each financial statement is used. Provide examples to support your claims. Working Capital's Role: Discuss how effective working capital management supports a healthy business. Working Capital Interpretation: Use the appropriate formula to calculate working capital, then discuss the business's current financial liquidity position. o For example, does the business have sufficient working capital on hand to address bills to suppliers? Will there be potential cash inflow at the end of the year? Working Capital Management Direction: Discuss the current direction of the business regarding working capital management. o keep in mind that financial statements reflect a specific moment or period of time and the value of the business's working capital during that period. To get a better understanding of the direction in which a business is going, use the business's balance sheets from Mergent Online to compare the business's value today against its value from one year ago Tesla Inc (NMS: TSLA) Audits ul. Report Date Currency Audit Status 12/31/2020 USD Not Qualified 12/31/2019 USD Not Qualified Yes Yes Thousands 26184000 Thousands 19952000 12/31/2021 USD Not Qualified Yes Thousands 44125000 1465000 1642000 47232000 2789000 3802000 53823000 32415000 978000 33393000 2918000 3906000 40217000 13606000 2593000 4517000 -27000 7083000 6523000 56000 371000 135000 -130000 125000 6348000 6343000 9000 839000 848000 Consolidated Scale Automotive revenue Automotive regulatory credits Automotive leasing revenue Total automotive revenue Energy generation & storage revenue Services & other revenues Total revenues Automotive cost of revenue Automotive leasing cost of revenue Total automotive cost of revenues Energy generation & storage cost of reven Services & other cost of revenues Total cost of revenues Gross profit (loss) Research & development Selling, general & administrative Restructuring & other Total operating expenses Income (loss) from operations Interest income Interest expense Other income (expense), net Income (loss) before income taxes - dome Noncontrolling interest & redeemable non Income (loss) before income taxes - foreig Income (loss) before income taxes Current state income taxes (benefit) Current foreign income taxes (benefit) Current income taxes (benefit) Deferred federal income taxes (benefit) Deferred foreign income taxes (benefit) Deferred income taxes (benefit) Provision for income taxes (benefit) Net income (loss) Net loss attributable to noncontrolling inte Net income attributable to noncontrolling i Net income (loss) attributable to common Less: Buy-out of noncontrolling interest Net income (loss) used in computing net i Weighted average shares outstanding - ba Weighted average shares outstanding - di Year end shares outstanding Net income (oss) per share - basic Net income (loss) per share - diluted Number of full time employees Number of common stockholders Foreign currency translation adjustments 1052000 27236000 1994000 2306000 31536000 19696000 563000 20259000 1976000 2671000 24906000 6630000 1491000 3145000 4636000 1994000 30000 748000 -122000 -198000 141000 1211000 1154000 4000 248000 252000 869000 20821000 1531000 2226000 24578000 15939000 459000 16398000 1341000 2770000 20509000 4069000 1343000 2646000 149000 4138000 -69000 44000 685000 45000 -287000 87000 465000 -665000 5000 86000 91000 4000 23000 19000 110000 -775000 -87000 -149000 -149000 699000 5644000 40000 40000 292000 862000 -141000 -862000 -125000 5519000 5000 5524000 986000 1129000 1033000 5.6 4.9 99290 7051 -308000 721000 -31000 690000 933000 1083000 960000 0.74 0.64 70757 5353 399000 885000 885000 905000 -0.984 -0.984 48016 1685 -28000 12/31/2020 USD Not Qualified Yes Thousands 862000 2322000 1734000 180000 202000 117000 114000 12/31/2019 USD Not Qualified Yes Thousands -775000 2154000 898000 188000 193000 146000 48000 228000 186000 -652000 422000 -1072000 -251000 -344000 2102000 321000 7000 1 Report Date 12/31/2021 2 Currency USD Audit Status Not 3 Qualified 4 Consolidated Yes 5 Scale Thousands 6 Net income (loss) 5644000 7 Depreciation, amortization & impairment 2911000 8 Stock-based compensation 2121000 9 Amortization of debt discounts & issuan 0 Inventory & purchase commitments write 140000 1 Loss on disposals of fixed assets 2 Foreign currency transaction net loss (ga 3 Foreign currency transaction net unrealiz -55000 4 Non-cash interest & other operating activ 245000 5 Digital assets gain, net -27000 6 Operating cash flow related to repayment 7 Account receivables -130000 8 Inventory -1709000 9 Operating lease vehicles -2114000 o Prepaid expenses & other current assets -271000 1 Other non-current assets -1291000 2 Accounts payable & accrued liabilities 4578000 3 Deferred revenue 793000 4 Customer deposits 186000 5 Resale value guarantee 6 Other long-term liabilities 476000 7 Net cash flows from operating activities 11497000 8 Purchases of property & equipment excli -6482000 9 Purchases of solar energy systems o Purchases of solar energy systems, net -32000 1 Purchases of digital assets -1500000 2 Proceeds from sales of digital assets 272000 3 Purchases of marketable securities -132000 4 Purchase of intangible assets 5 Receipt of government grants 6000 6 Business combinations, net of cash acq 7 Net cash (used in) flows from investing a -7868000 8 Proceeds from issuances of common sto 9 Proceeds from issuance of convertible & 8883000 o Repayments of convertible & other debt -14167000 -1 Collateralized lease repayments -9000 2 Proceeds from exercise of stock options 707000 3 Principal payments on finance leases 439000 4 Debt issuance costs -9000 5 Common stock & debt issuance costs 6 Purchase of convertible note hedges 7 Proceeds from issuance of warrants 8 Proceeds from investment by noncontrol 2000 9 Distributions paid to noncontrolling intere -161000 o Payments for buy-outs of noncontrolling -10000 1 Net cash flows from financing activities -5203000 2 Effect of exchange rate changes on cast -183000 3 Net increase (decrease) in cash & cash -1757000 4 Cash & cash equivalents & restricted ca 19901000 5 Cash & cash equivalents & restricted ca 18144000 6 Cash paid during the period for interest, 266000 7 Cash paid during the period for taxes, ne 561000 -188000 -367000 429000 -764000 -288000 115000 682000 801000 -58000 -150000 109000 2405000 -1327000 -105000 495000 5943000 -3157000 -75000 -10000 123000 -13000 -3132000 12269000 9713000 -11623000 -240000 417000 -338000 -6000 -5000 46000 -45000 -1436000 848000 10669000 -9161000 -389000 263000 -321000 24000 -208000 -35000 9973000 334000 13118000 6783000 19901000 444000 115000 -37000 476000 174000 279000 -311000 -9000 1529000 8000 2506000 4277000 6783000 455000 54000